Concept mapping for problem solving
Most businesses use mind maps or spider mapping - slightly restricted tree-structured concept maps - for planning and ideation, especially in marketing and other customer service professions. However, concept maps are also useful for problem solving as well as learning and knowledge sharing across all teams and professions.
Concept mapping in education
Concept maps are likely the first type of diagram you drew. Schools encourage them for language learning and vocabulary training, to learn how to categorise and group things, and for essay writing to organise related information to make your writing flow.
Concept maps use simple shapes such as circles, ovals, rectangles or underlined text to represent the concepts. Related concepts are linked with connectors with optional connector labels and arrow heads to explain the type and direction of a relationship.
Mind maps versus concept maps
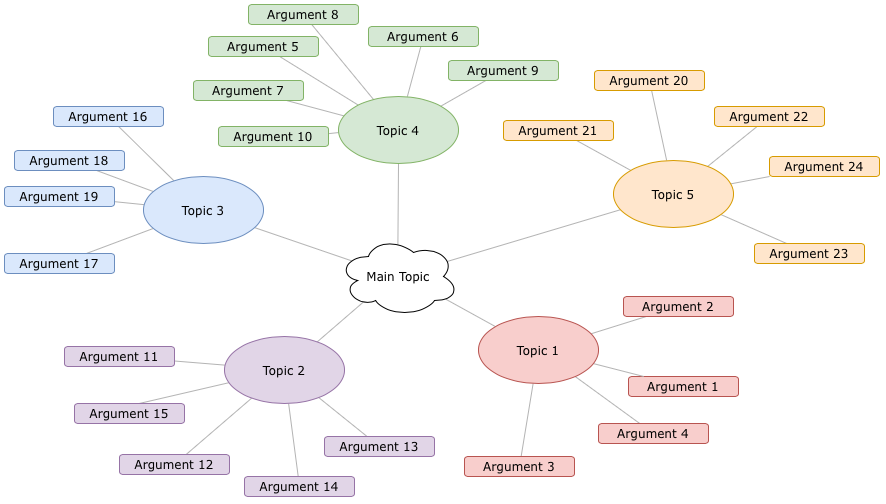
Mind maps have one central node from which all concepts branch out in a tree-like structure. Relationships between concepts on different branches are not typically included.
Tip: draw.io has an automated mindmap shape so you don’t have to worry about rearranging your diagram every time you add a new concept.
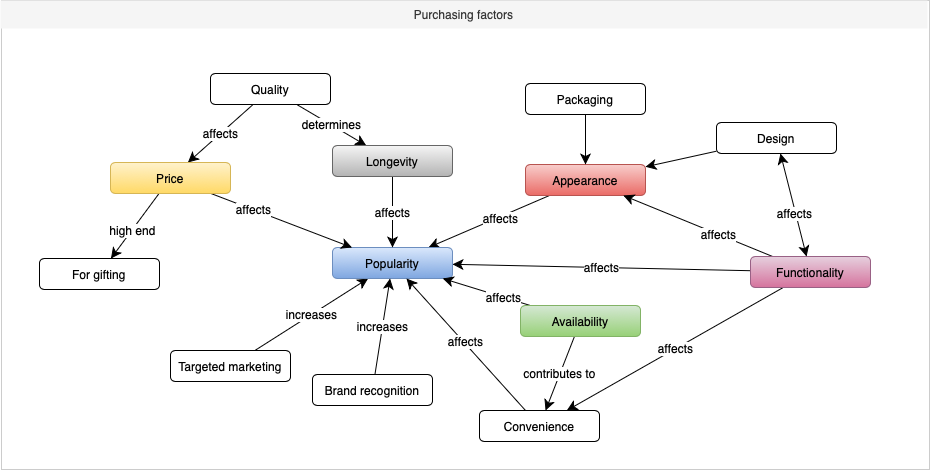
Concept maps are broader and more flexible than mind maps. Concepts may belong to multiple groupings or be related to concepts in other parts of the map, so the diagram will appear more like a network rather than a tree structure.
An earlier post showed how you can create concept maps in draw.io. This post looks at how concept maps are being used in today’s technology and research and focuses on using concept maps as problem-solving tools.
While concept maps aren’t usually considered technical diagrams, their organisational structure and function underpin many technical diagramming standards, including UML, one of the most widely used diagramming notations.
Concept maps in machine learning
Categorisation of information into concept maps is also a key technology in improving large language models (LLMs) like ChatGPT and AI tools. Semantic networks organise, group, classify and relate data from many different sources. In essence, this is a large concept map that the LLM uses to interpret queries and generate appropriate responses, all based on those linked concepts.
These large concept maps also form the backbone of search engines and semantic search tools.
Tip: LLMs can generate reasonable concept maps when you prompt them with a topic, such as through the smart templates feature in draw.io (below).
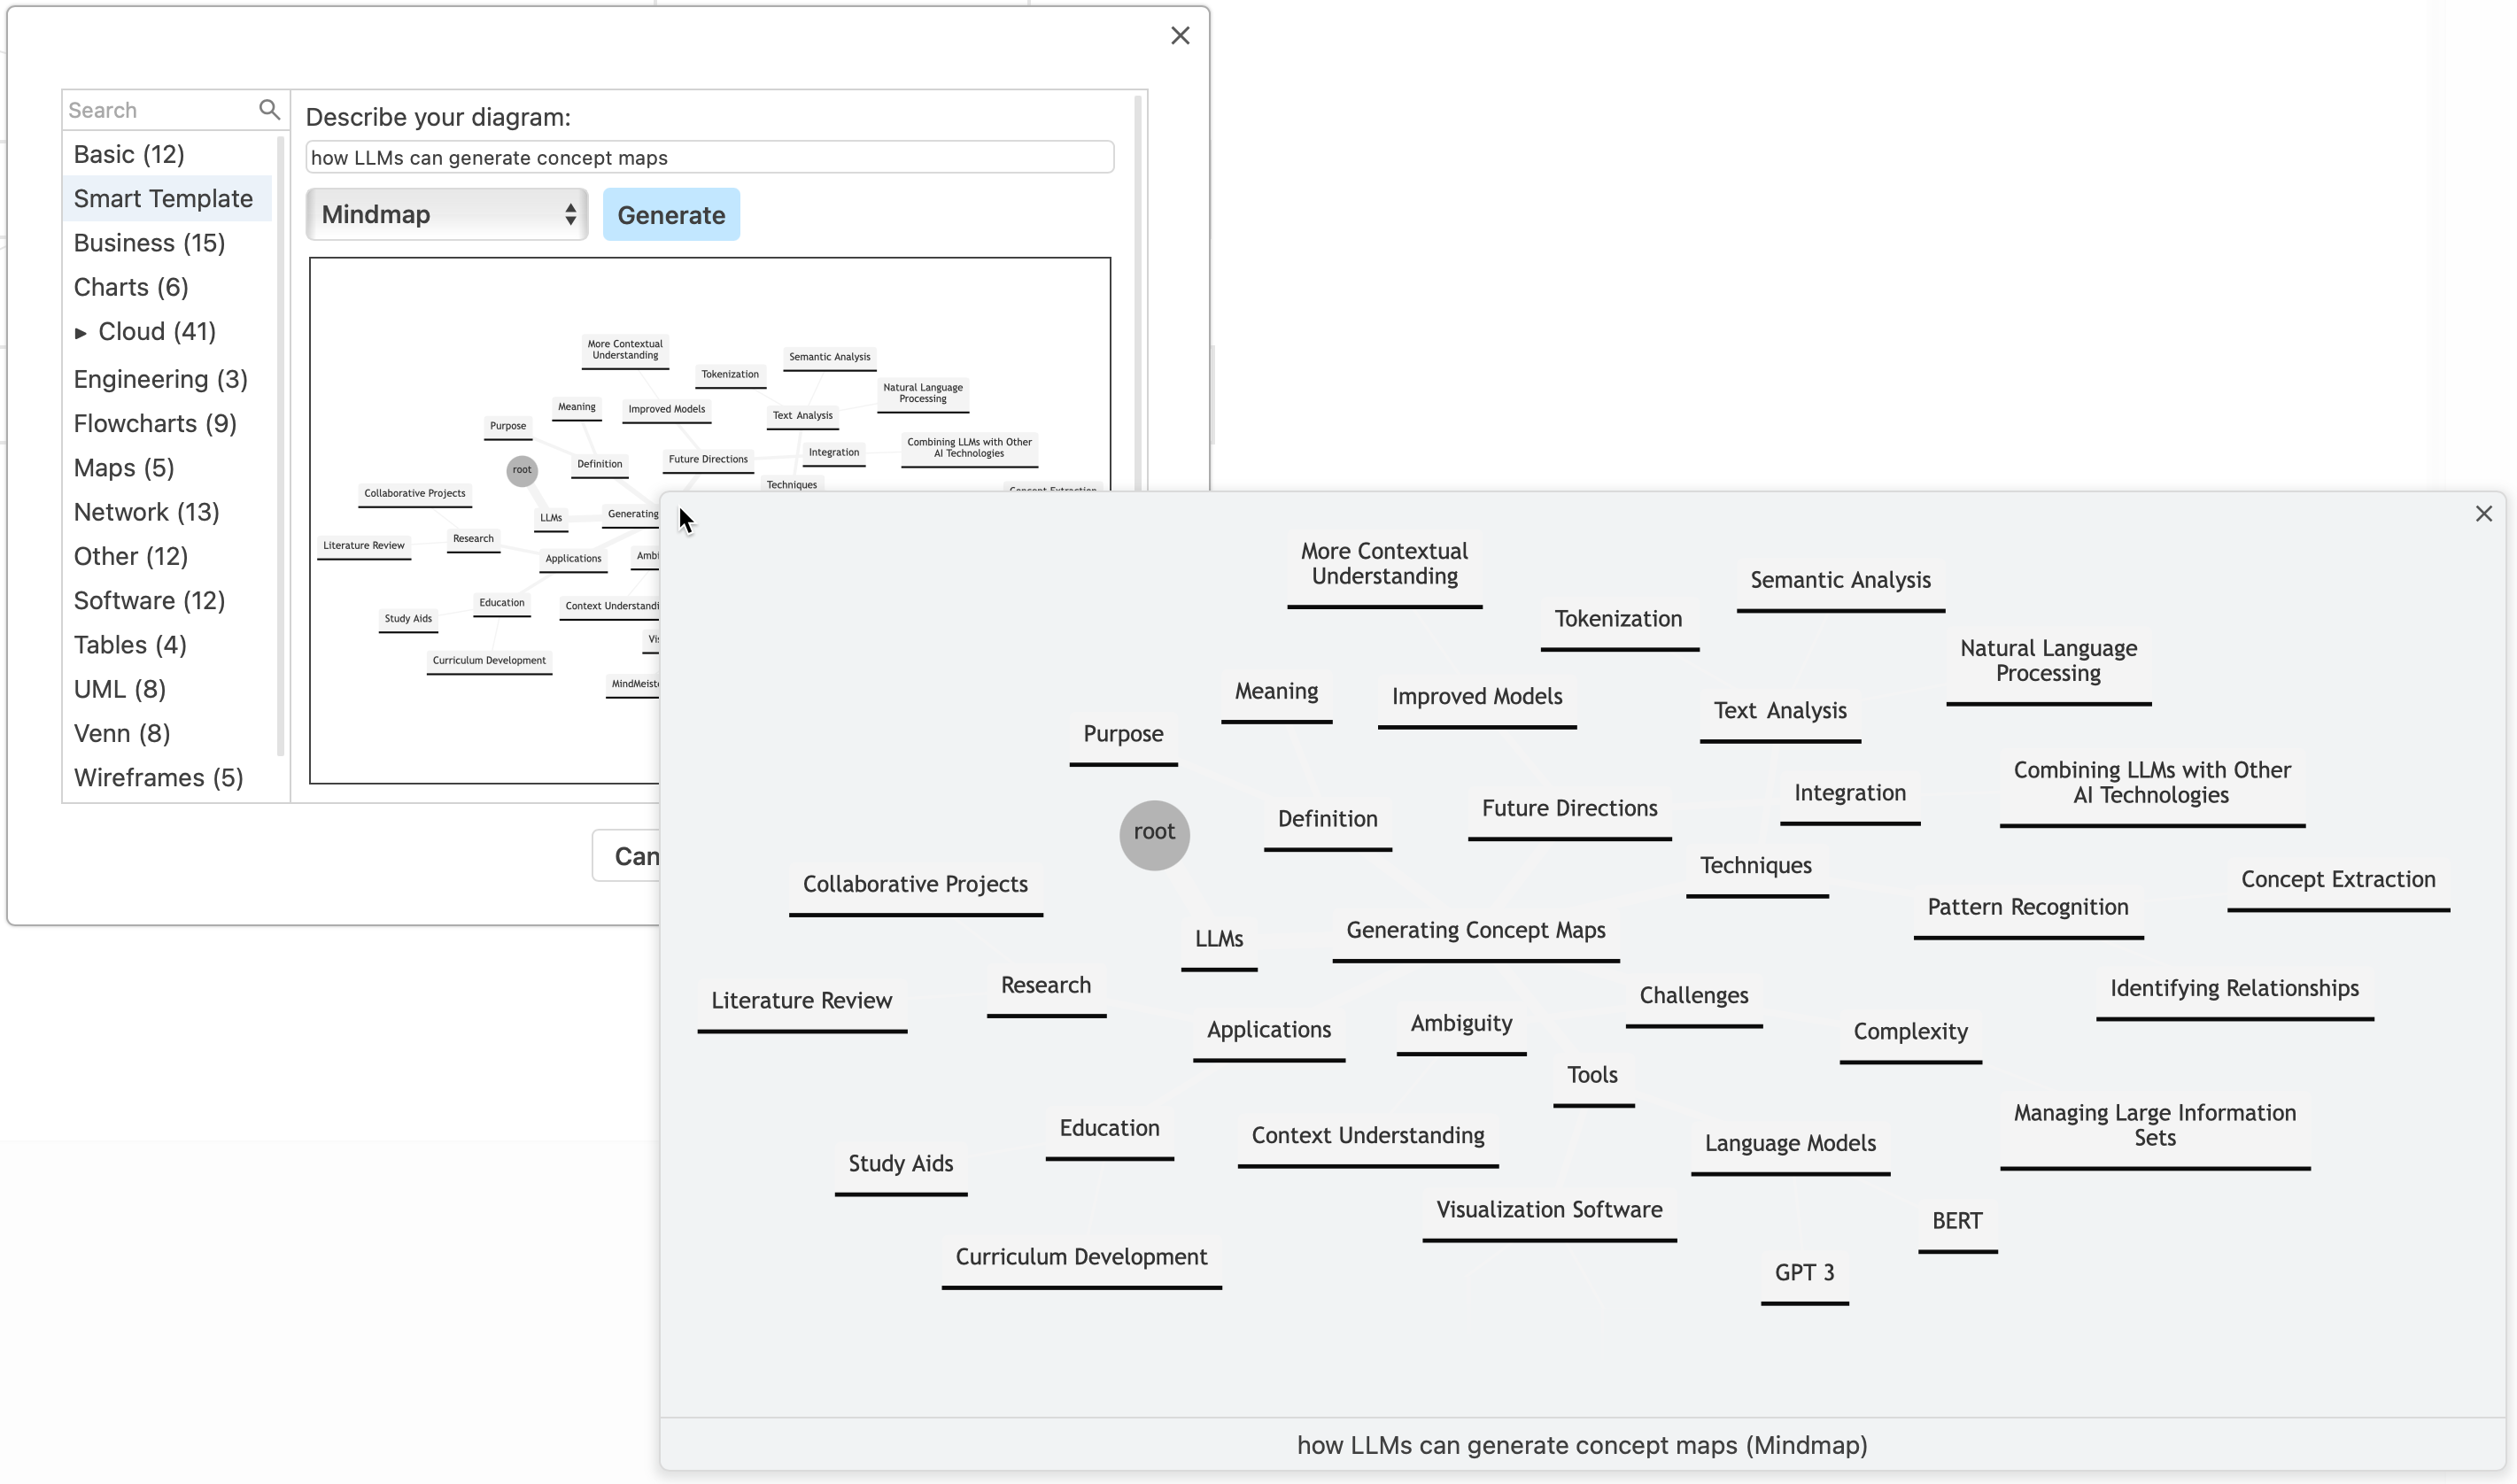
These have been found to be as helpful as those provided by teachers, although they are less flexible - LLMs can’t combine cross-domain concepts as effectively. However, to develop critical thinking and problem solving skills, student learn best when they draw their own concept maps.
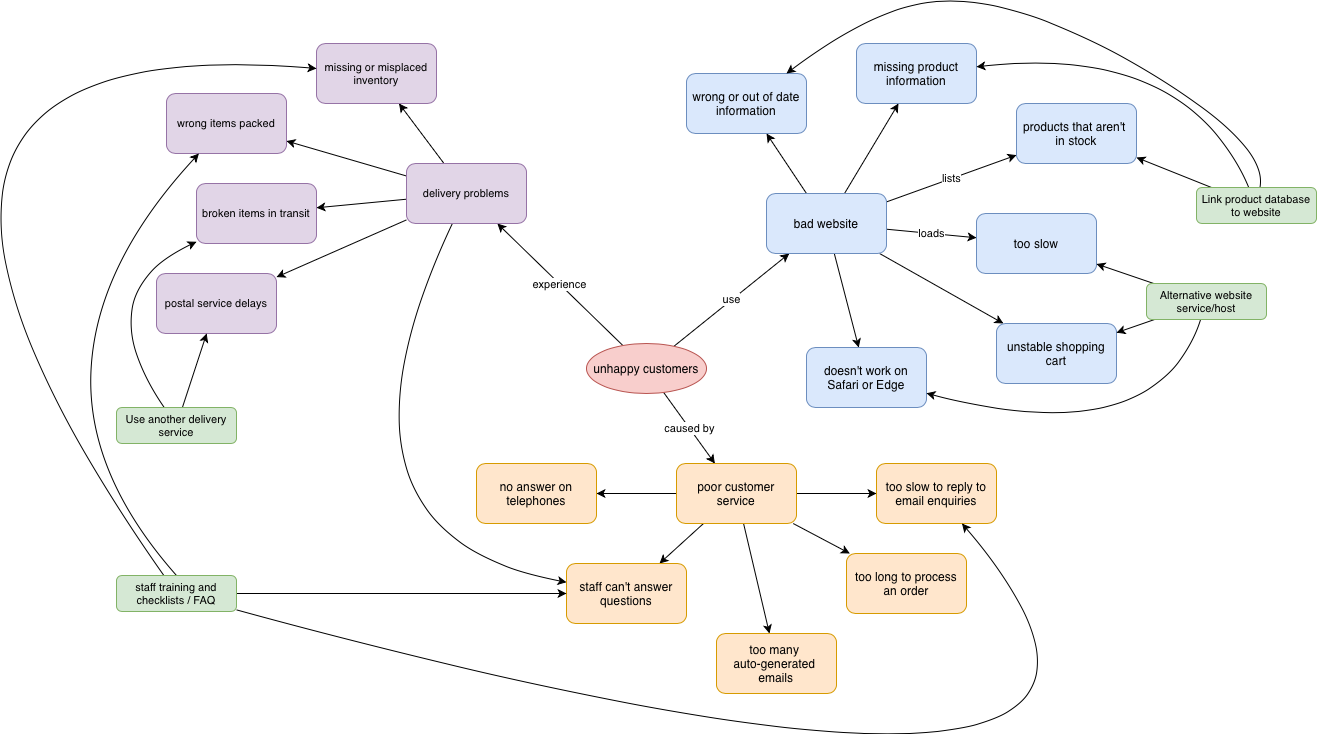
Problem solving with concept maps
The goal of drawing a concept map to solve a problem is not to be 100% accurate and correct, and it is not even to find the right solution. It is to help you understand the complexities of the problems and therefore make better decisions to solve those problems.
- Start with a central topic or problem statement.
- Note the other problems and causes (concepts) around the central topic, grouping them into related groups.
- Draw connectors between related problems and label those connectors if appropriate.
- Repeat steps 2 and 3 until your map feels like it represents the relationships between all the concepts in reasonable detail.
- Add potential solutions and interventions and link these to the problems they address.
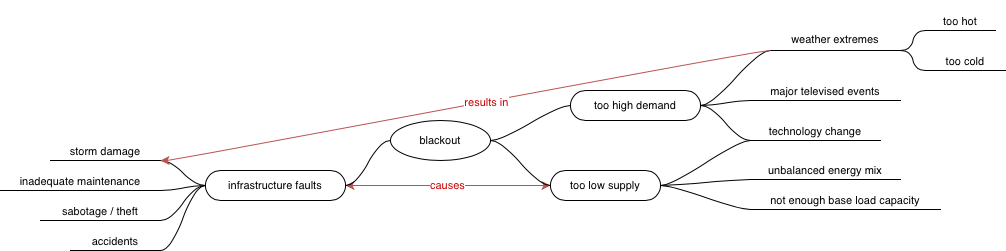
Failure or error maps
Draw a concept map of failure events or errors and then draw connections between related events. It is quite likely you will find one or two events that are the root cause of many other failures down the road.
Concept mapping is a good way to understand how historical events influence or cause later events in all types of industries and society in general.
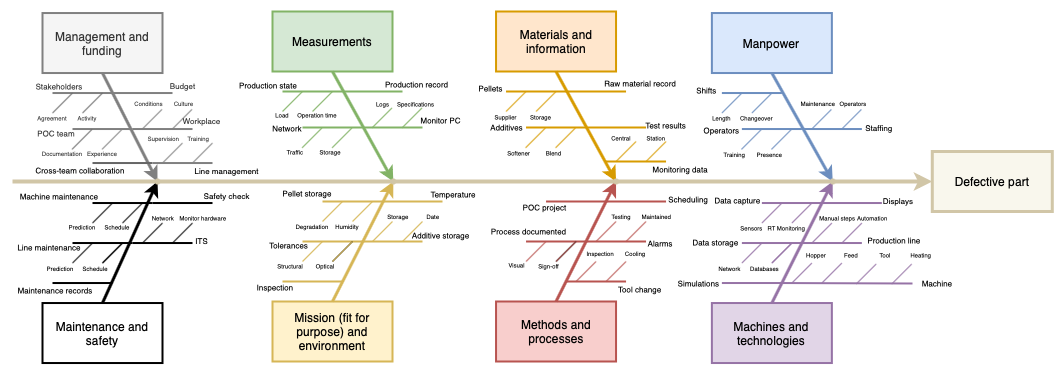
Ishikawa diagrams to relate cause and effect
Ishikawa or fishbone diagrams are a structured type of concept map, commonly used in manufacturing and engineering for pinpointing the causes of problems in a system.
Visualising potential problems in concept maps
Risk and probabilities are also often visualised in concept map-like diagrams. Probability flows note the relationships between events and the likelihood of them occurring. Risk maps group and relate events and concepts that contribute to the success or failure of a project.
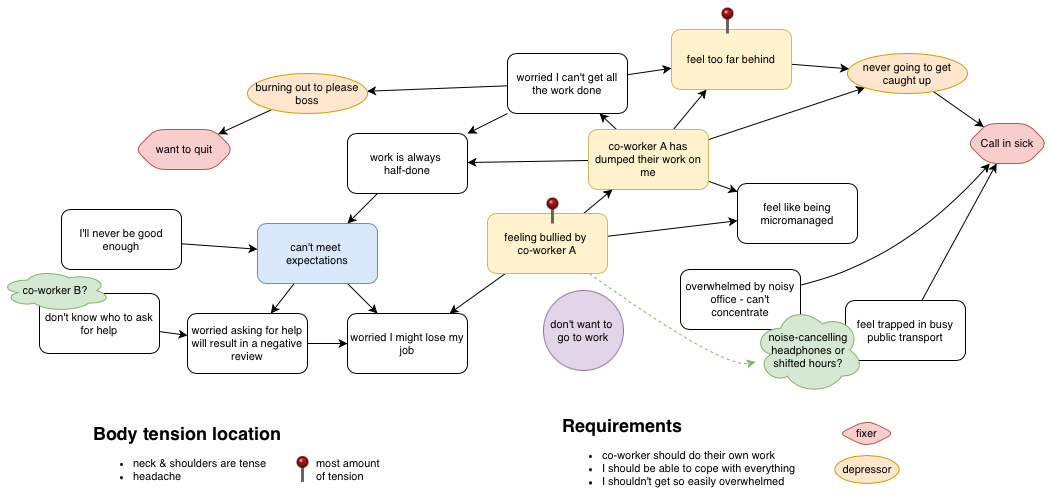
Concept maps to treat trauma
One promising mind-body bridging technique and stress management technique for treating post traumatic stress disorder (PTSD) and related sleep disorders uses concept mapping extensively. Patients are encouraged to draw these maps daily during their therapy.
- Draw problematic thoughts, feelings and trigger events in the map and connect them.
- Use grounding awareness or mindfulness - consciously note physical sensations while drawing the maps - this helps you detach yourself from the emotions and think a little more objectively.
- Note body tension on the map and highlight the worst statements or triggers - those that cause the most amount of tension.
- Requirements that you are putting on yourself (fairly or unfairly) are noted.
- You can include potential interventions or skills you could use to help regain or maintain a more relaxed state.
While these concept maps are usually drawn with paper and pen for their physical sensation, you can use draw.io to similar effect. Note the feel of the mouse as you move it, the keys of the keyboard as they press down, the tapping and clicking sounds and the hum of the computer, and the movement of the cursor across the screen as you do the concept mapping exercises in the diagram editor.
Concept maps to improve medical care
On a larger scale, systems mapping by various support organisations is commonly used to help communities affected by traumatic events or disasters and evaluate response measures. Concept mapping is already used extensively to improve care for patients throughout the medical industry.
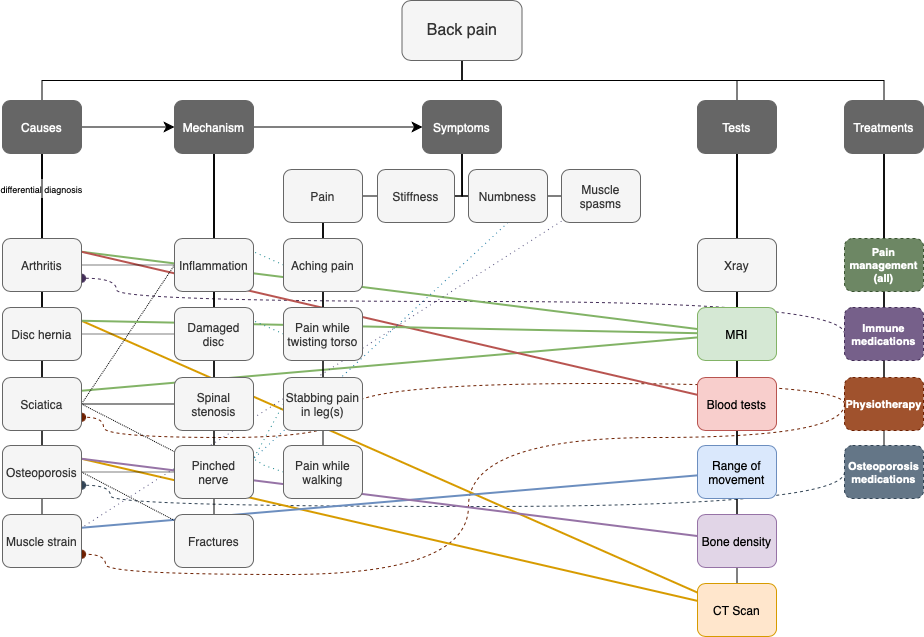
The growing popularity of concept mapping in research and in developing diagnostic AI tools (example differential diagnosis map below) is spurring calls for the establishment of a concept mapping standard.
Team concept mapping combats knowledge gaps
No two people will draw the same concept map as everyone has different gaps in their knowledge and emphases different things. That makes concept mapping for problem solving or idea generation an excellent team activity.
Either draw the map together - in draw.io, use the real-time collaborative editing feature - or have each team member draw their own concept maps and bring them together in one diagram. Drag and drop each diagram onto its own page in a multi-page diagram.
Alternatively, if you want an immediate visual comparison, drag and drop each person’s diagram into a new layer on the same page. You can show or hide layers via the Layers dialog (View > Layers or press Ctrl+Shift+L / Cmd+Shift+L).