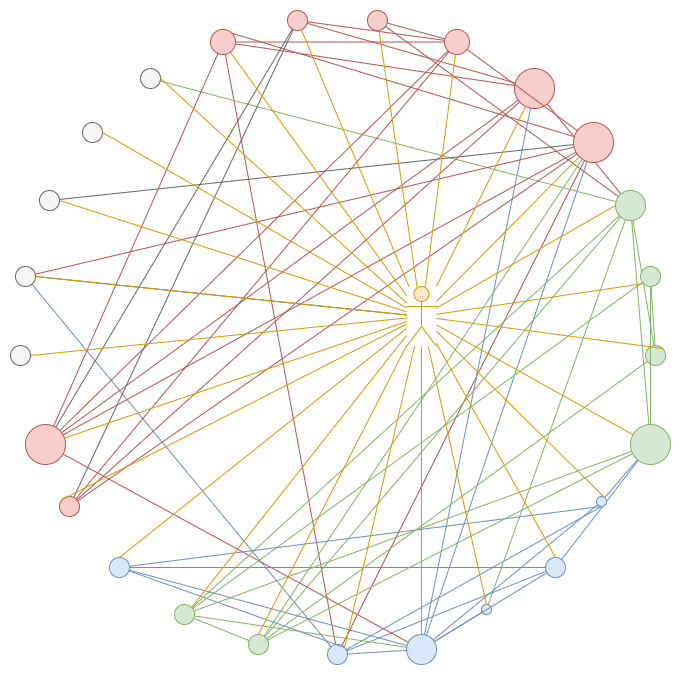
Network and infrastructure diagrams
Network diagrams, or infrastructure diagrams, let you understand a computer network quickly.
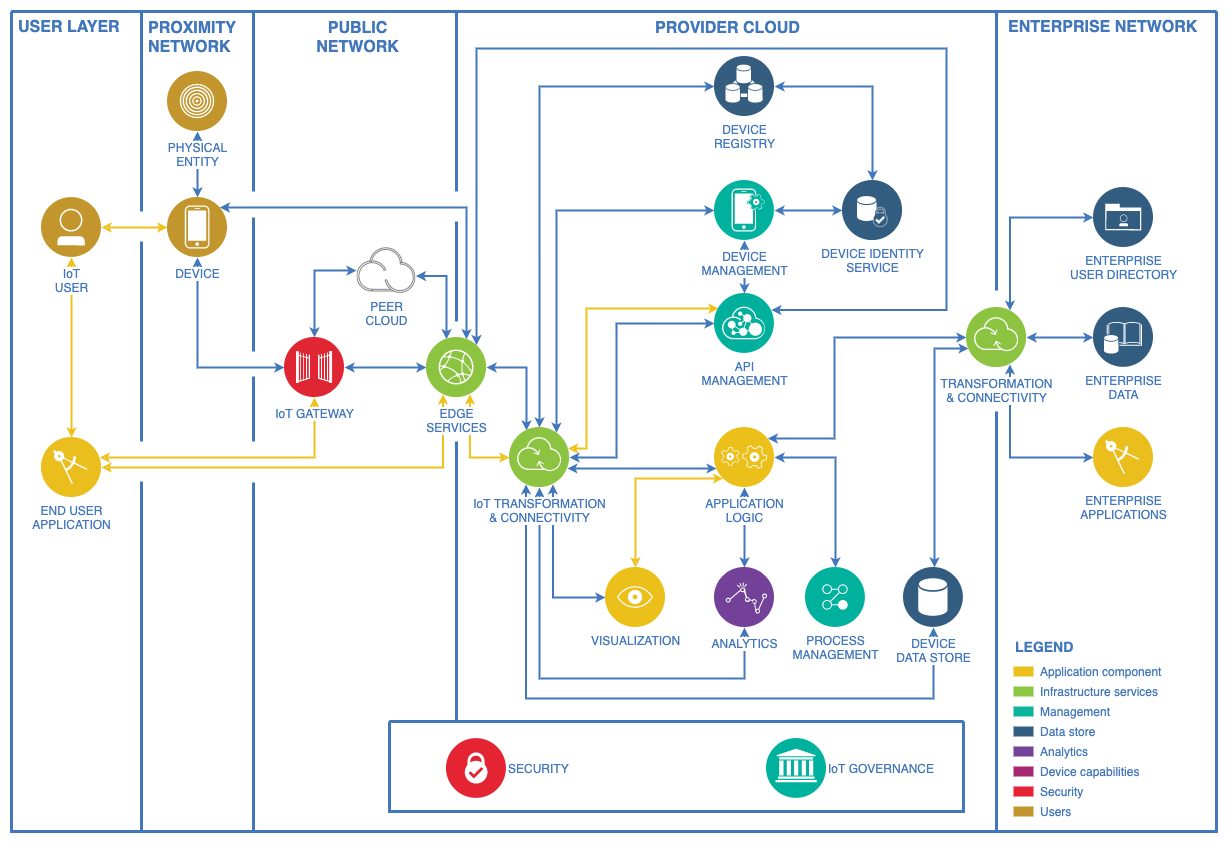
A variety of symbols, shapes and colours are used to indicate the types of devices attached to the network and their groups.
Such devices include firewalls, routers, printers, hubs, switches, and other devices in home and office networks, but also things like databases, factory machines, sensors and more in industrial settings.
Groups may be based on security or access controls, subnets, or location - whichever suits your use case.
Connectors between them indicate the lines of communication.
Additional information, like IP addresses, or group labels are usually added as text.
There are many ‘common’ libraries of shapes that you can use to create your network diagram. Some, like Amazon’s AWS cloud shapes, offer hundreds of different shapes indicating the different tasks performed by each device.
Why are network diagrams useful?
Network diagrams are created and updated for many reasons:
- plan for new infrastructure or a move to the cloud
- estimate costs for network upgrade proposals
- troubleshoot problems
- track where devices are installed
- ensure new purchases or upgrades will work with existing devices
- analyse for risk management
- comply with a variety of security and business auditing requirements
Shape libraries for various network diagrams
draw.io contains a large number of shape libraries that you can use to create your network diagram.
- Click on More Shapes at the bottom of the left panel.
- Scroll down to the Networking section.
- Enable the shape libraries you want to use, and click Apply.
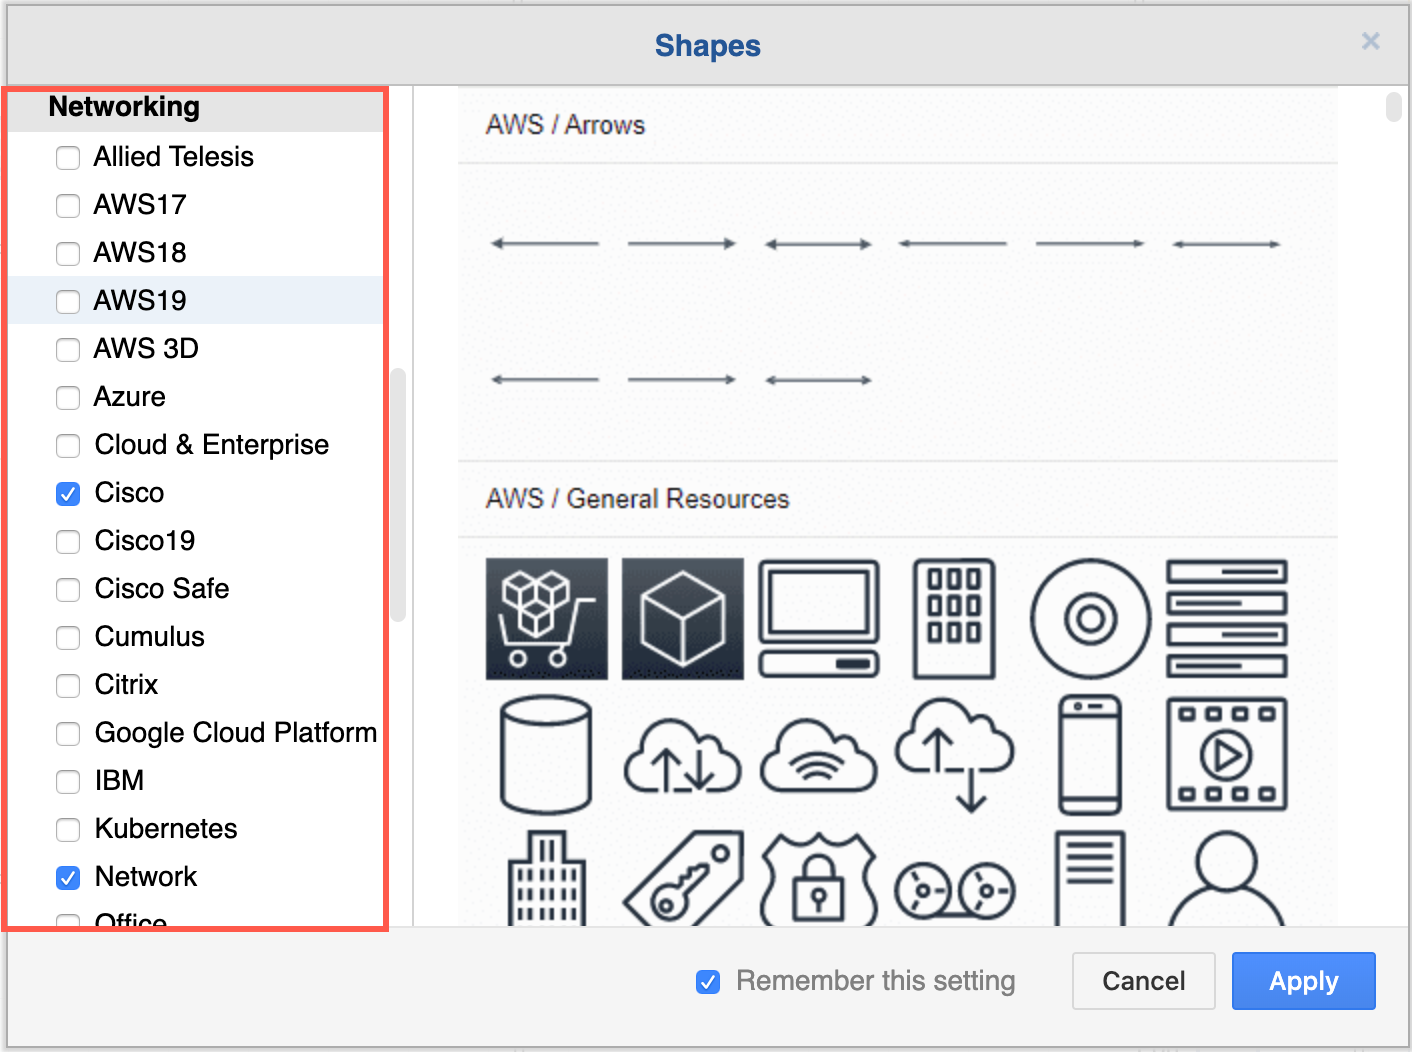
Some of the more popular shape libraries include:
Cloud infrastructure diagrams
AWS: Amazon updates its shapes regularly, and these are sorted into collections by year - AWS17, AWS19. Enable the AWS 3D library to use the isometric AWS shapes. When you enable one of these libraries, you’ll see several categorised shape libraries appear in the left panel.
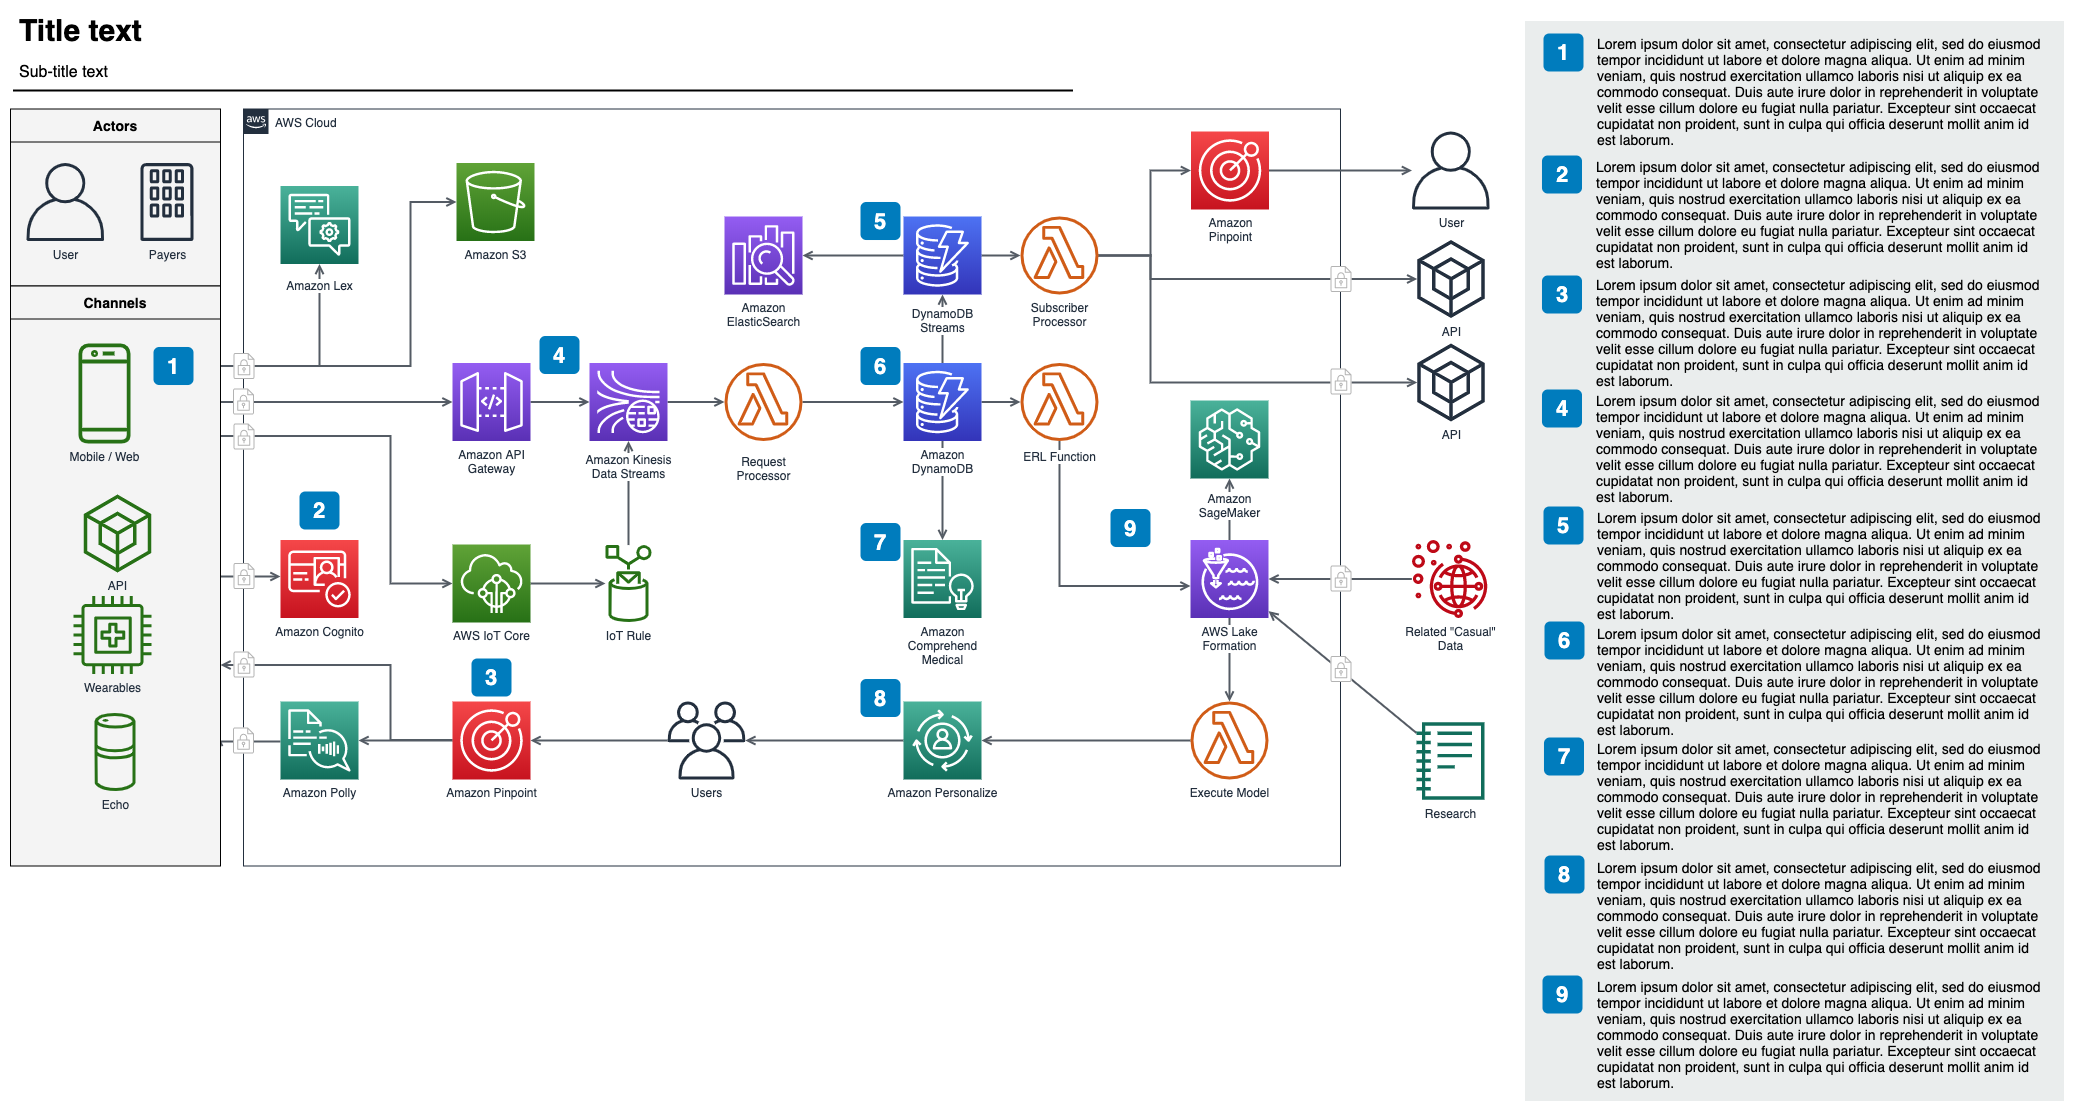
Open this diagram in our online diagram viewer
Some AWS automatic monitoring services export to the .drawio file format, including Cloudockit and Cloudcraft.
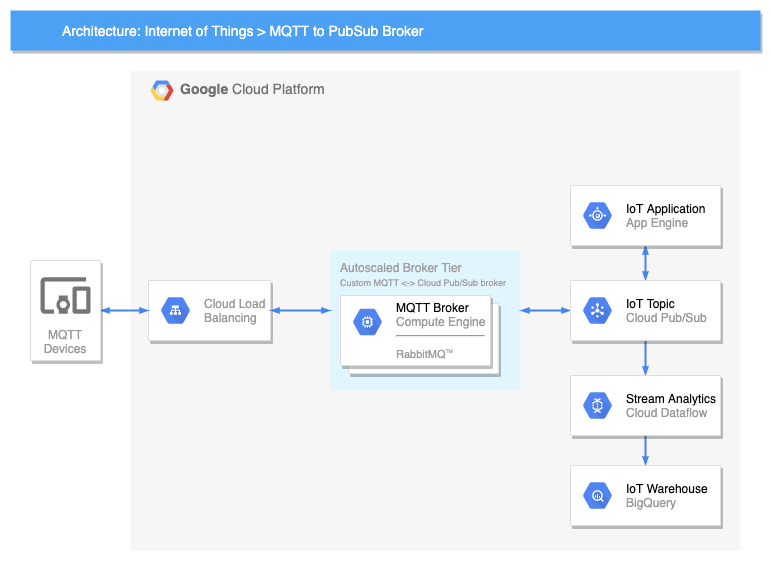
Google Cloud Platform: GCP shapes are much more text-heavy than the other cloud providers.
IBM, VMWare, Veeam and others are used for both physical and cloud network diagrams. Below is a template infrastructure diagram for IoT devices running on Google Cloud.
Open this diagram in our online diagram viewer
Physical network diagrams
Cisco: Probably the most common set of shapes for visualising your physical network assets and how they are connected.
There are many other more stylised shape libraries that may be better for presentations, should you need to present the network to management.
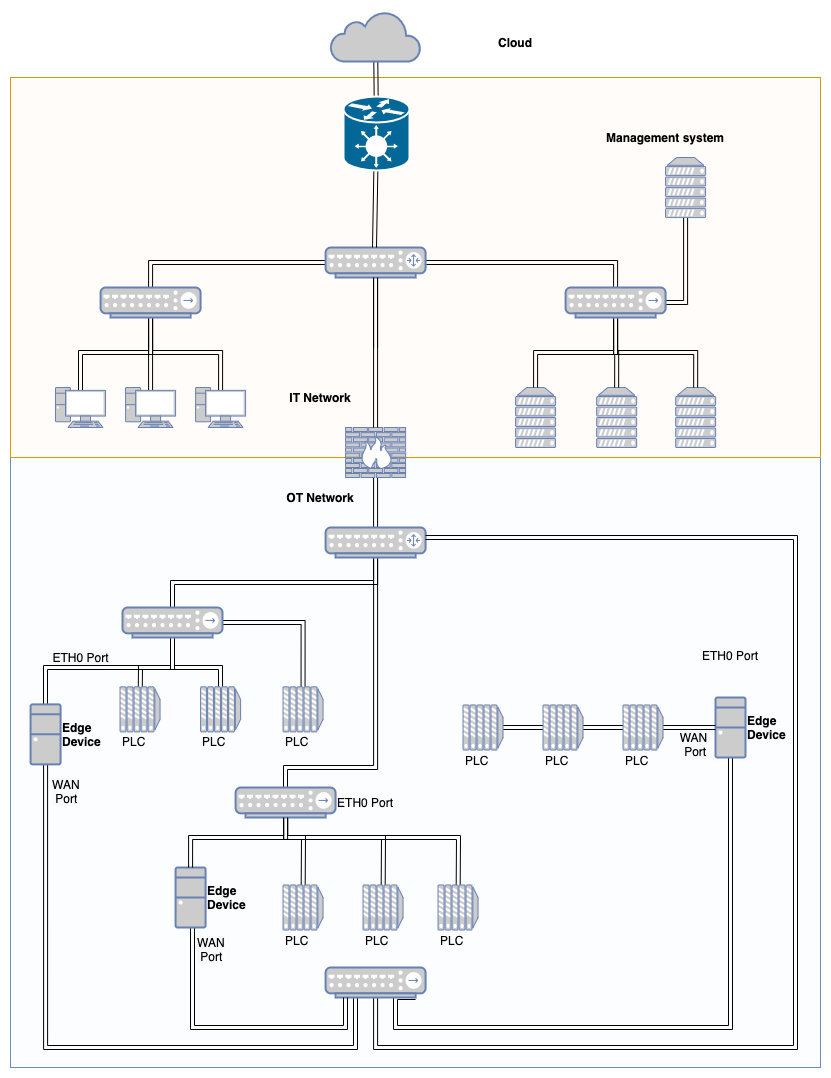
If you aren’t working with any particular platform, feel free to pick the shapes that make the most sense to your teams. For example, the following is an IT-OT network diagram for a industrial manufacturer, using shapes from the Cisco and Networks shape libraries available in draw.io.
Open this diagram in our online diagram viewer
Bus topology
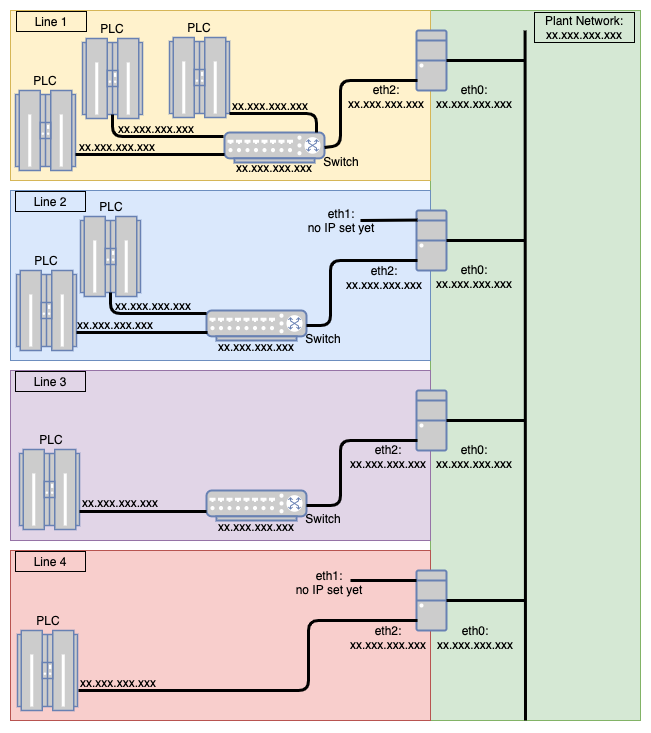
Occasionally, you may want to show how various subnets are connected to a main communications channel (or bus). These almost always include the IP addresses of the devices that are attached to the network, and may indicate what type of connections each uses.
The example below has been anonymised, but is from an actual use case for a manufacturing company. It’s using shapes from the Network shape library in diagrams.net.
Open this diagram in our online diagram viewer
Placeholders make updating network diagrams easier
Advanced tip: You can use placeholders to assign values automatically to device labels based on the subnet of the container shape. For example, then when you drag a device from one subnet to another, its IP will automatically update.
See how to work with placeholders
Network diagram templates in draw.io
A wide variety of network template diagrams are available in draw.io.
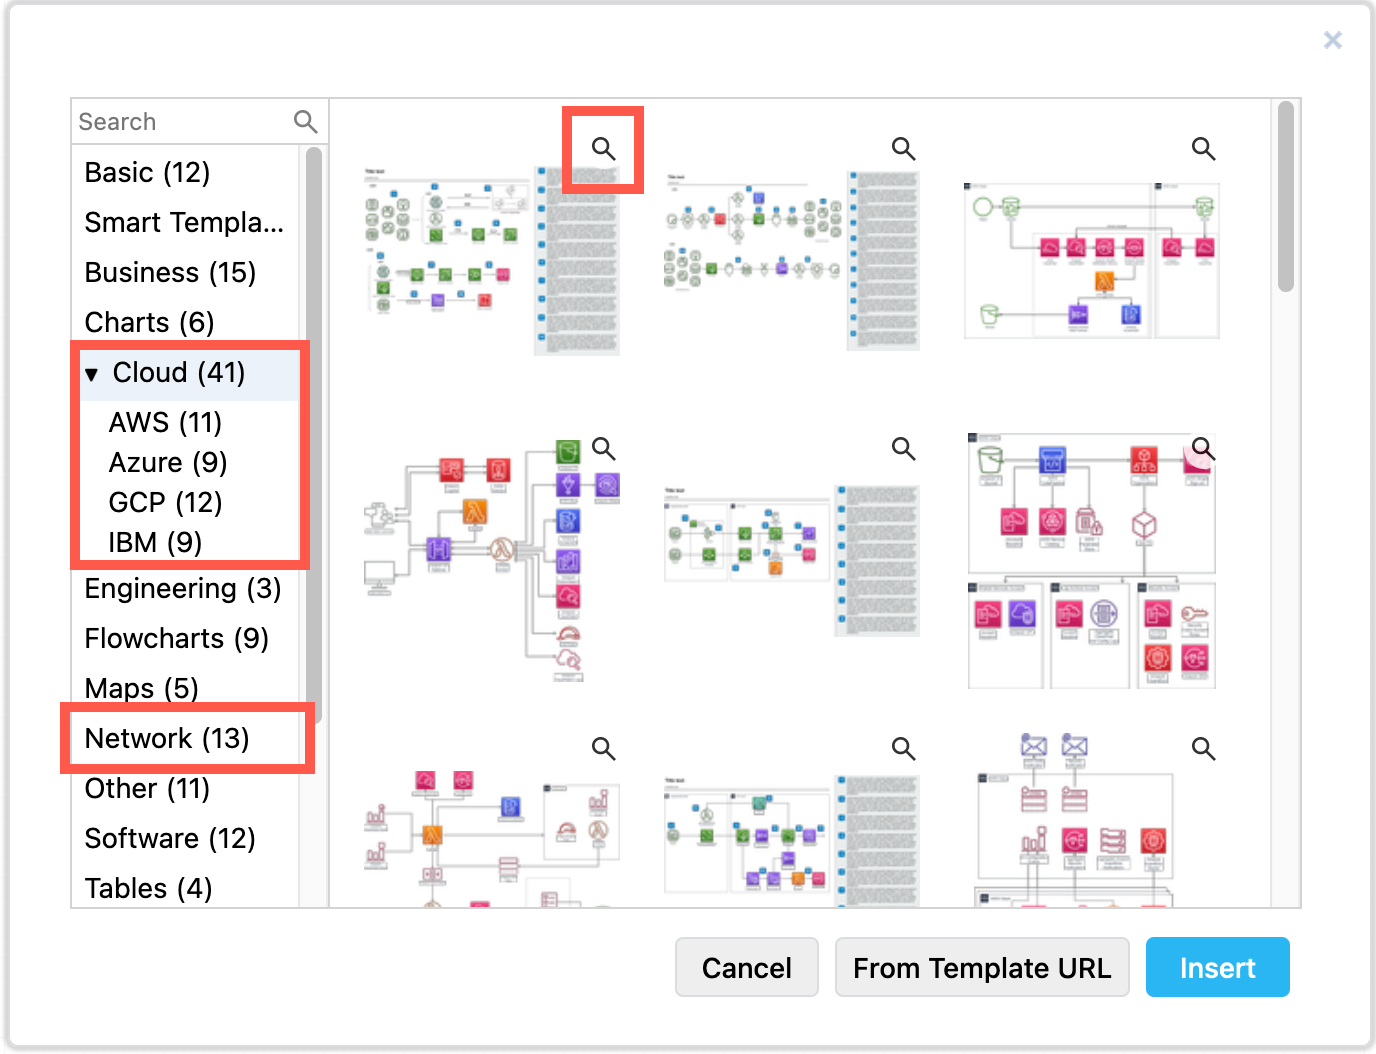
- When you create a new diagram, expand the Cloud section to see cloud infrastructure templates sorted by platform, or select the Networking section on the left.
- Click on the magnifying glass in the top right to see a larger preview of a template diagram.
- Click Create to create a new diagram using that template.
You can also insert a template diagram. Click Arrange > Insert > Template, then follow the two steps above.
Other network diagrams
There are several other types of network diagrams that are used for specific applications, often as a graph visualisation.
- Neural network diagrams visualise a model based on a biological neural network.
- Signal interaction network diagrams are used in biochemistry, quantum chemistry, molecular dynamics, and more.
- Project network diagrams represent the steps to complete the project, and are more like a flow chart.
- Sociometric charts or sociograms show the connections from one person to others in their social network - something that is increasingly easy to visualise from our social media accounts.
- Data flow diagrams represent components in an information system and the communication channels between them.
