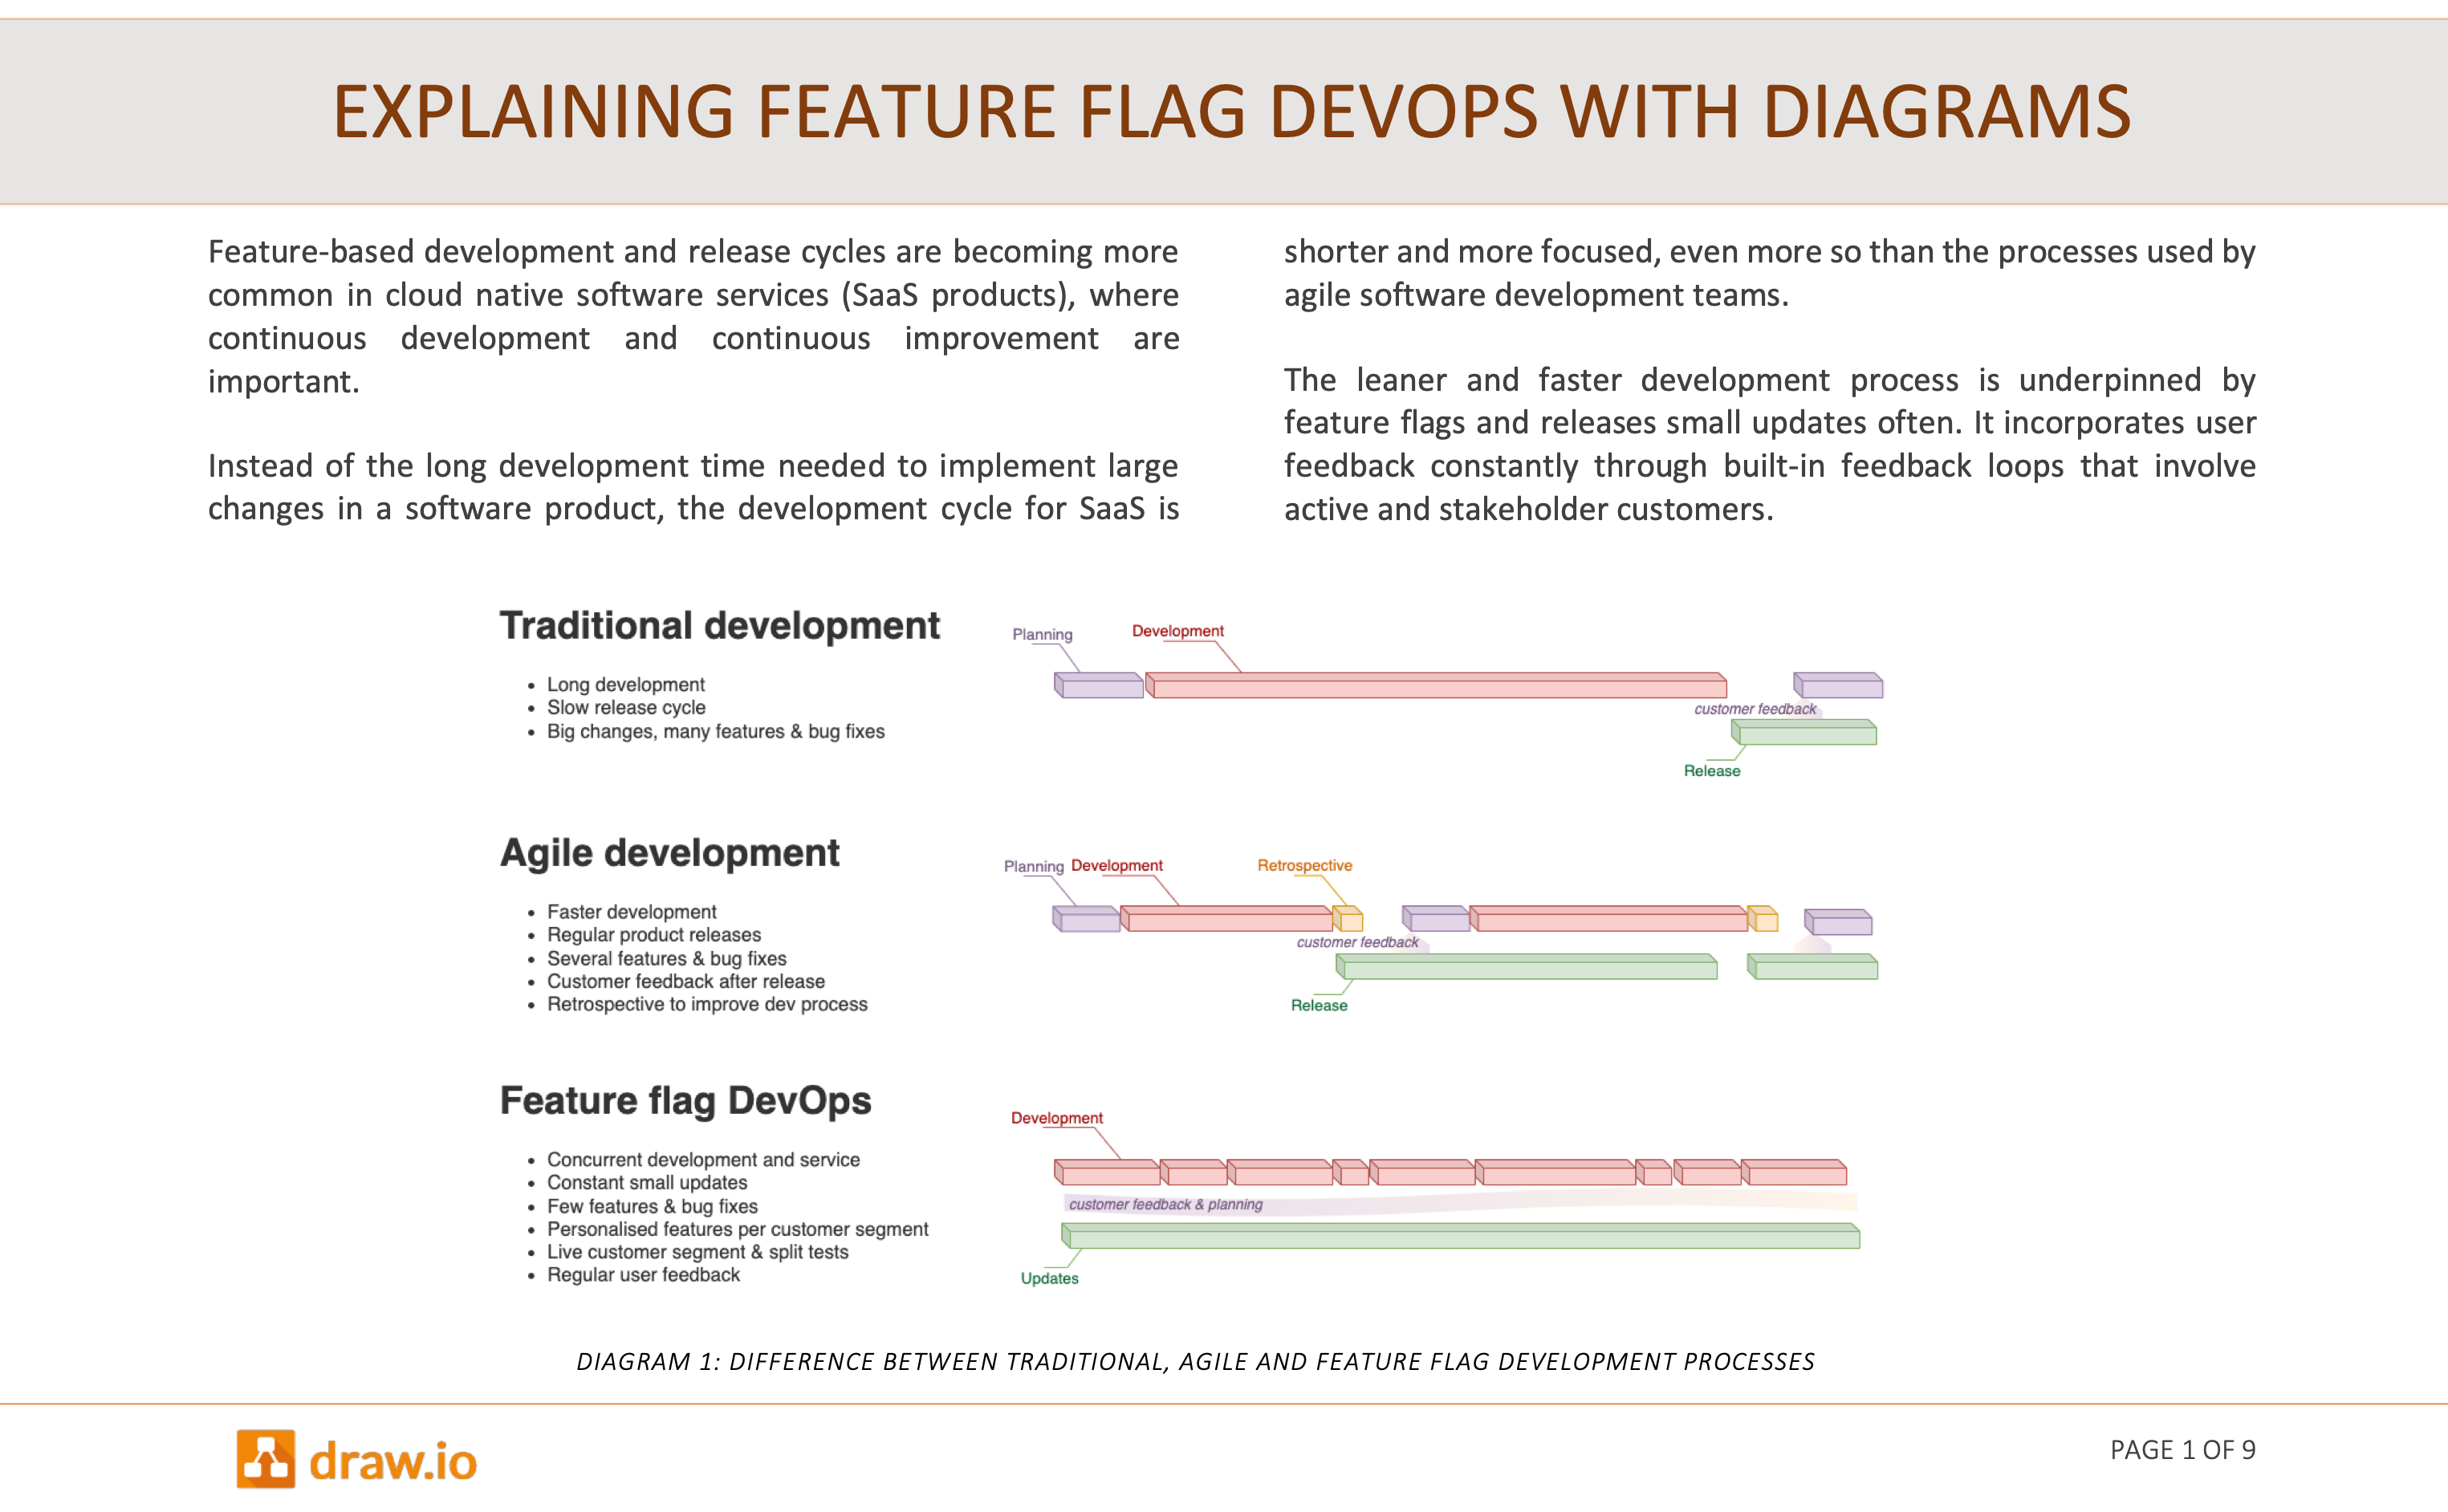
Explain feature flag DevOps easily with diagrams
Explaining new technologies to a less technical audience, like management-level stakeholders, can be difficult. Our whitepaper explains feature flags DevOps in clear diagrams how feature flags work and how they could benefit your product.

Explaining feature flag DevOps with diagrams whitepaper (PDF version)
When fast development, updates and releases are required by online services, feature flags make it easier to incrementally test updates, serve customised deployments, roll back when errors are encountered, and respond quickly to customer requirements.
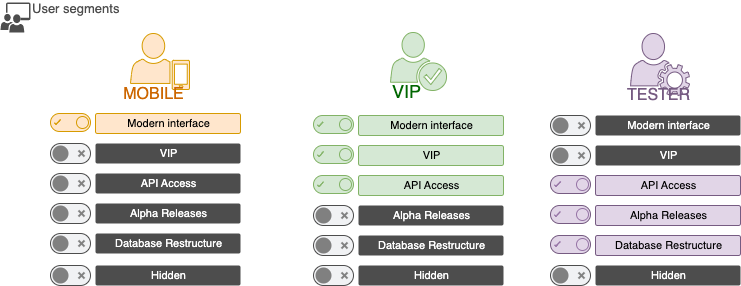
From one deployed code base, feature flags are used toggle functionality in both the user interface and the back end on or off for specific customer segments.
While feature flags don’t change the development process overly much, as detailed in our earlier post on using feature flags in gitflow diagrams, they do require larger changes in the operations part of DevOps.
Diagrams help you explain clearly
To justify these changes, you’ll need to convince stakeholders. Diagrams convey complex information clearly and reduce misunderstandings - important in discussions to justify changes to existing processes,
You can draw the wide variety of diagrams you need for presentations and whitepapers more quickly and neatly in our diagram editor than if you would use the built-in presentation or word document diagramming tools.
All of the diagrams in our feature flag DevOps whitepaper were created in draw.io, using the built-in shape libraries and icons found using search terms.
Add diagrams to proposals and documentation
You can add diagrams wherever you need to communicate with your team and stakeholders.
-
Embed the diagrams directly in your presentations and documents, using either Google or Microsoft applications.
-
Embed diagrams in Confluence or Notion pages for proposals and meetings.
-
Embed diagrams in GitHub or GitLab pages to clearly document your processes and infrastructure.

