How to write better queries for smart generated diagrams
Query writing, also known as prompt engineering, is becoming an important skill as large language models and AI tools become more popular. It is hard to write a good query to ensure a good outcome from any type of content generator. Here’s how you can make the most of the diagram generation features in draw.io.
How it works
Enter a text query in the template manager and draw.io submits it to a large language model tool - draw.io will automatically select the best tool for the type of diagram you specify. This AI tool processes your query and returns a diagram in Mermaid syntax or draw.io XML. When a diagram is generated with the built-in draw.io shapes (not Mermaid), you can style and update your diagram easily.
Generated diagrams may be a good start for simpler types of diagrams, such as flowcharts, sequence diagrams, concept maps and tree diagrams, or for brainstorming. Mermaid does not support technical diagrams with more complex notations such as AWS, Azure, BPMN, and so on. But you can easily drag and drop these from their shape libraries in draw.io to replace the generic shapes used in your generated diagrams.
Important: As with all AI or smart content generation tools, you should not include any sensitive information - don’t include any private, personal and confidential business information in any query you write.
Diagram generation is disabled by default if you are using the draw.io apps for Confluence or Jira Cloud. Ask your administrator to enable this option in the draw.io app configuration in their instance settings.
Generate a smart template diagram
Open the template library: Click Arrange > Insert > Template or create a new diagram to open the template library dialog. If you use Simple mode or the Sketch editor theme, click on + in the toolbar and select Template.
-
Generate a diagram from text: Click on the Generate box on the first page of the template library to show a text box where you can enter your text query. Press
Enteror click OK to submit it to the generator.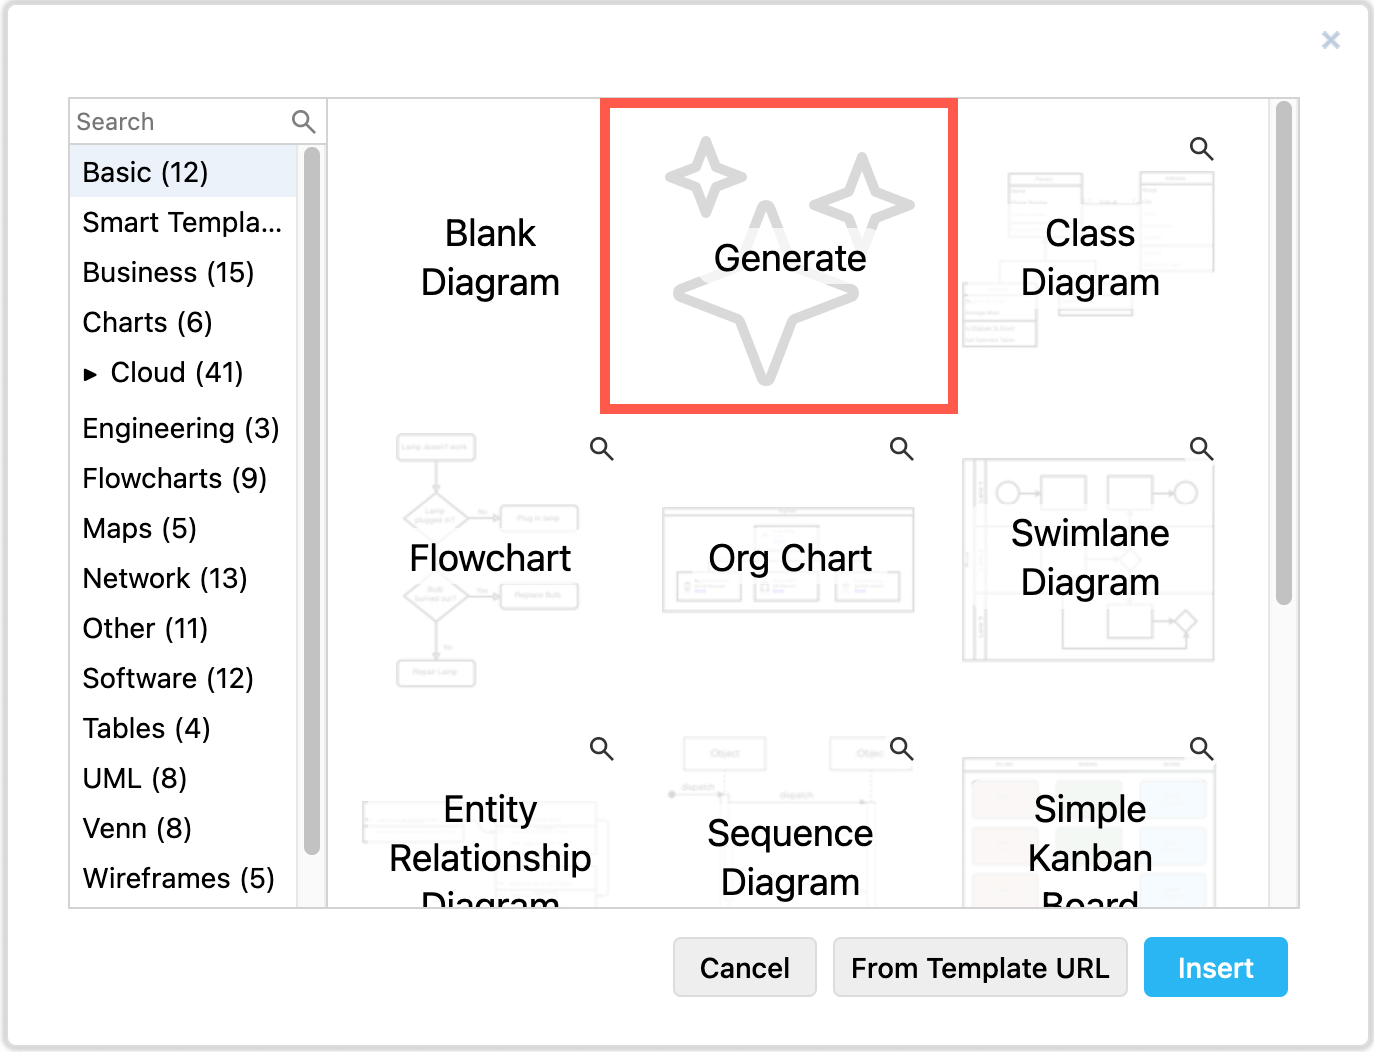
-
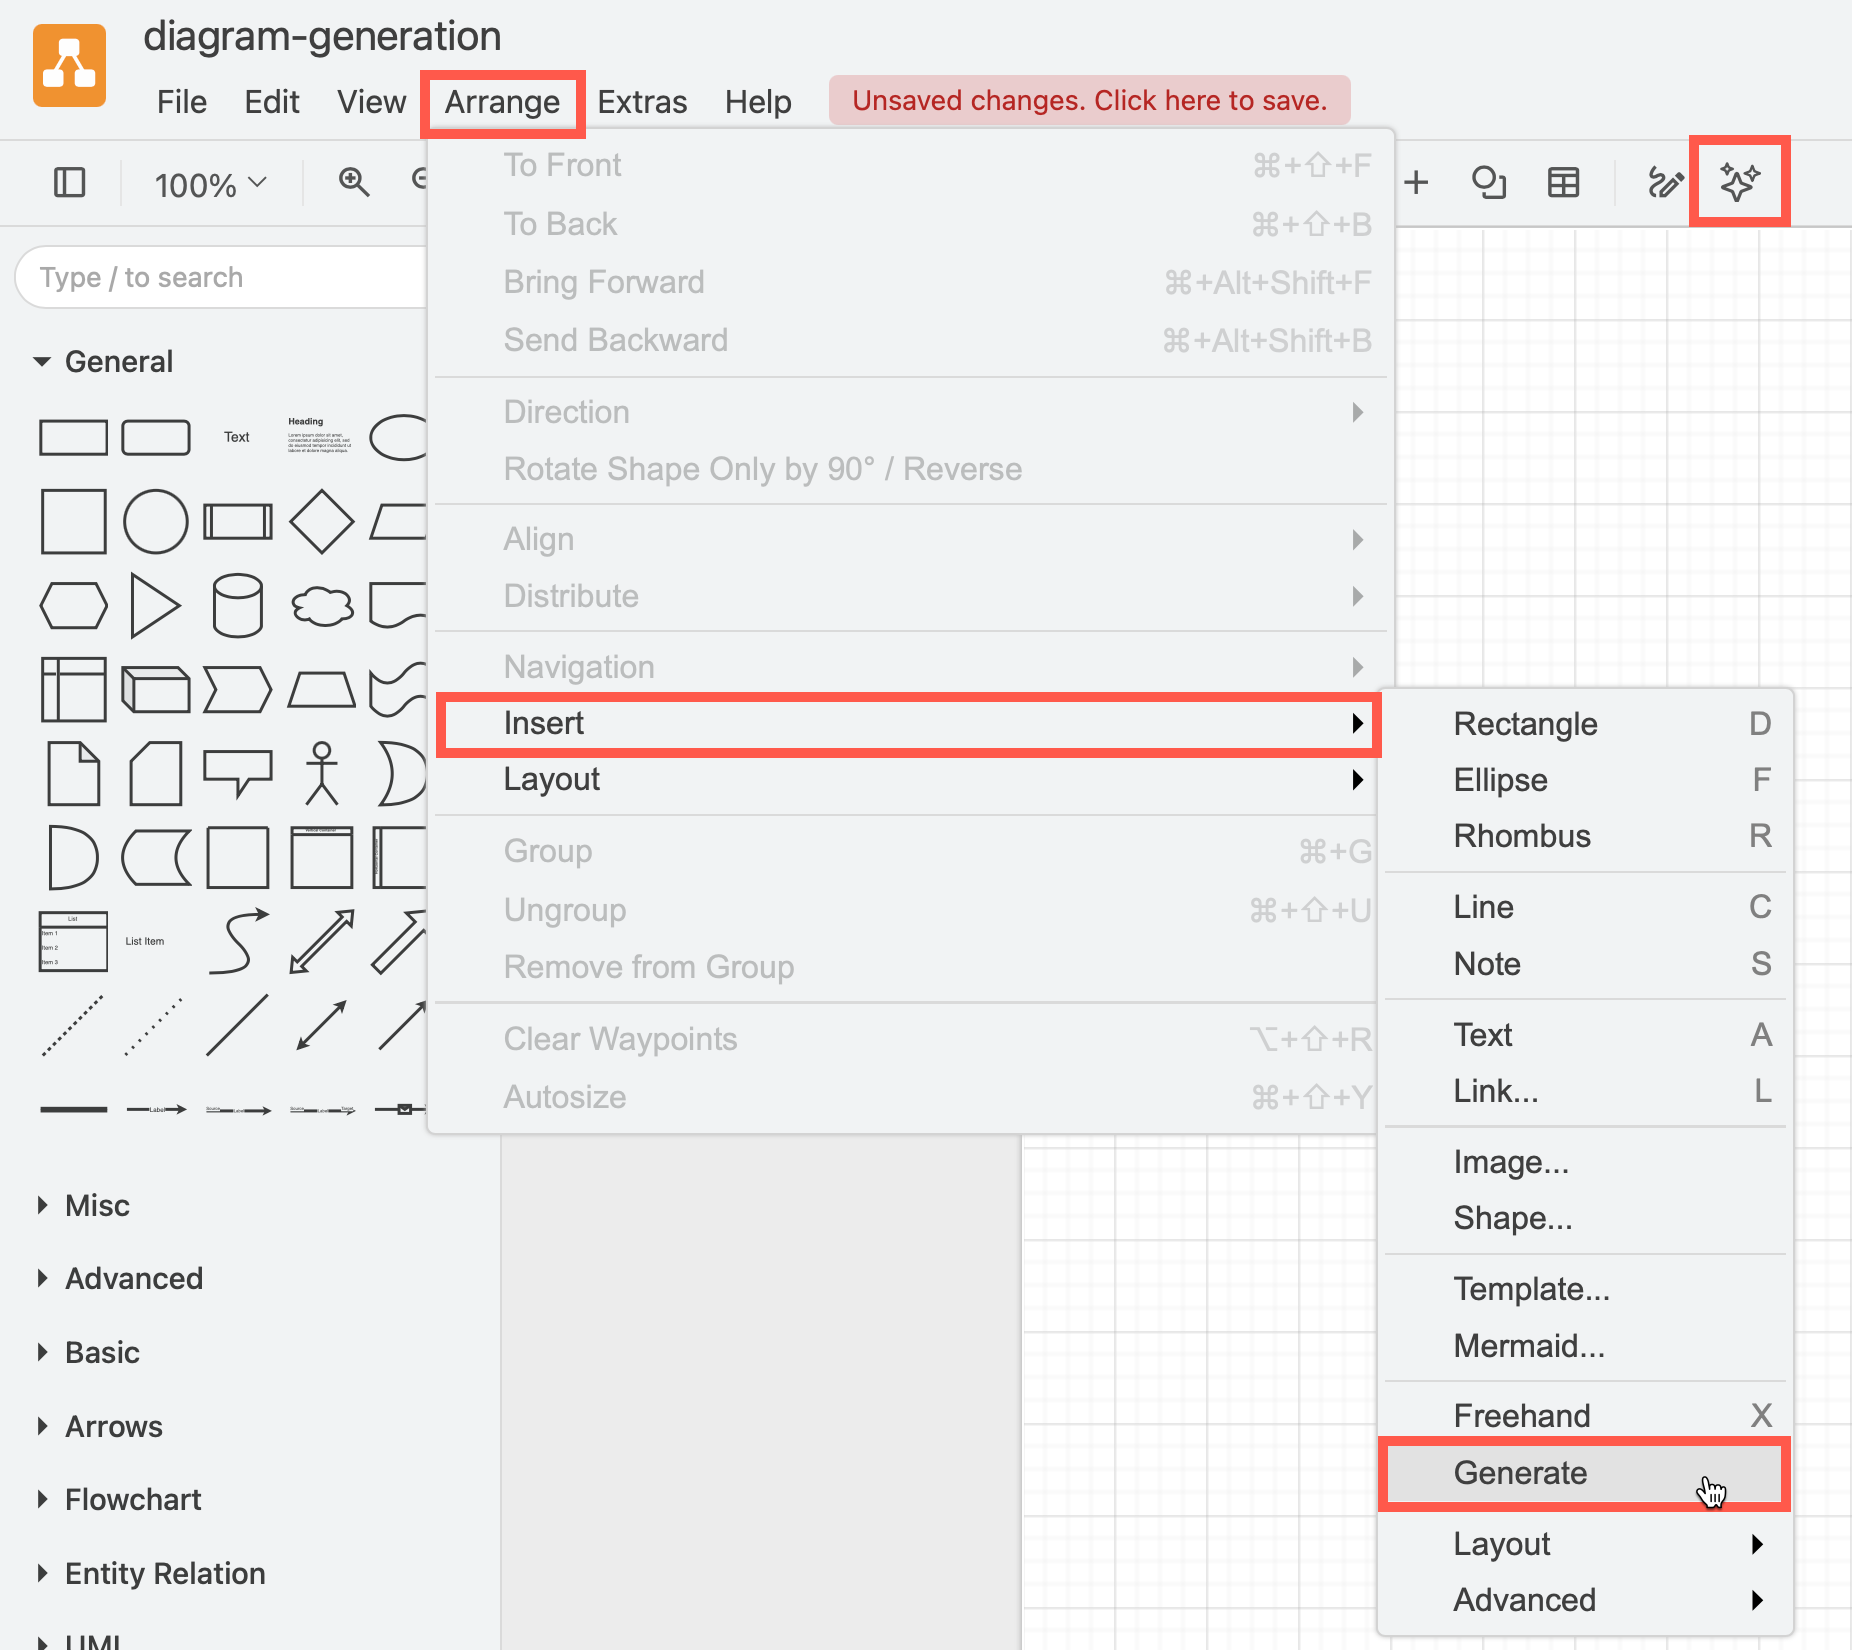
Open the Generate dialog: Click on the sparkle tool or select Arrange > Insert > Generate from the menu, then enter your prompt in the Generate dialog.
-
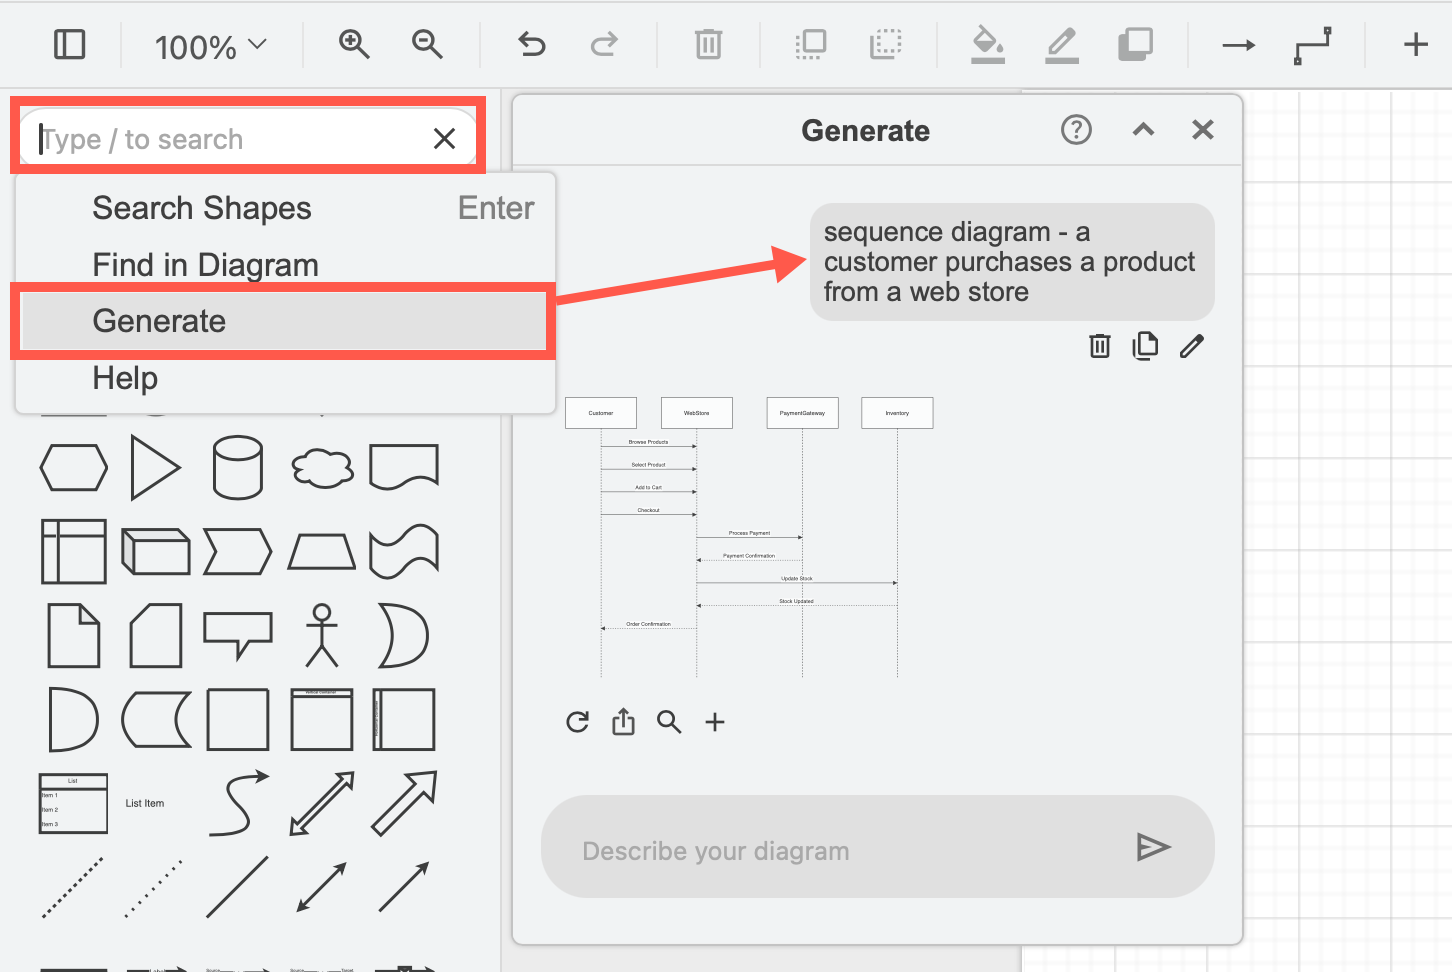
Generate a diagram from the search field: Write your query directly into the search field and select Generate.
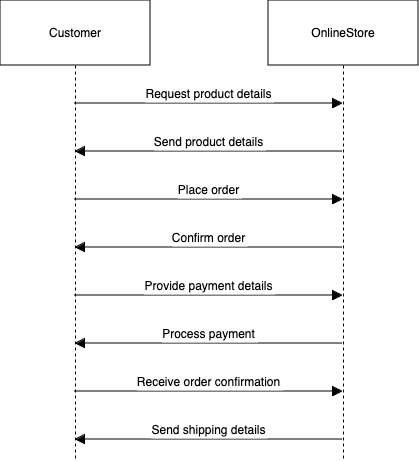
Generate another version using the same description
Generated diagrams will be different each time you generate or regenerate it using the same query.
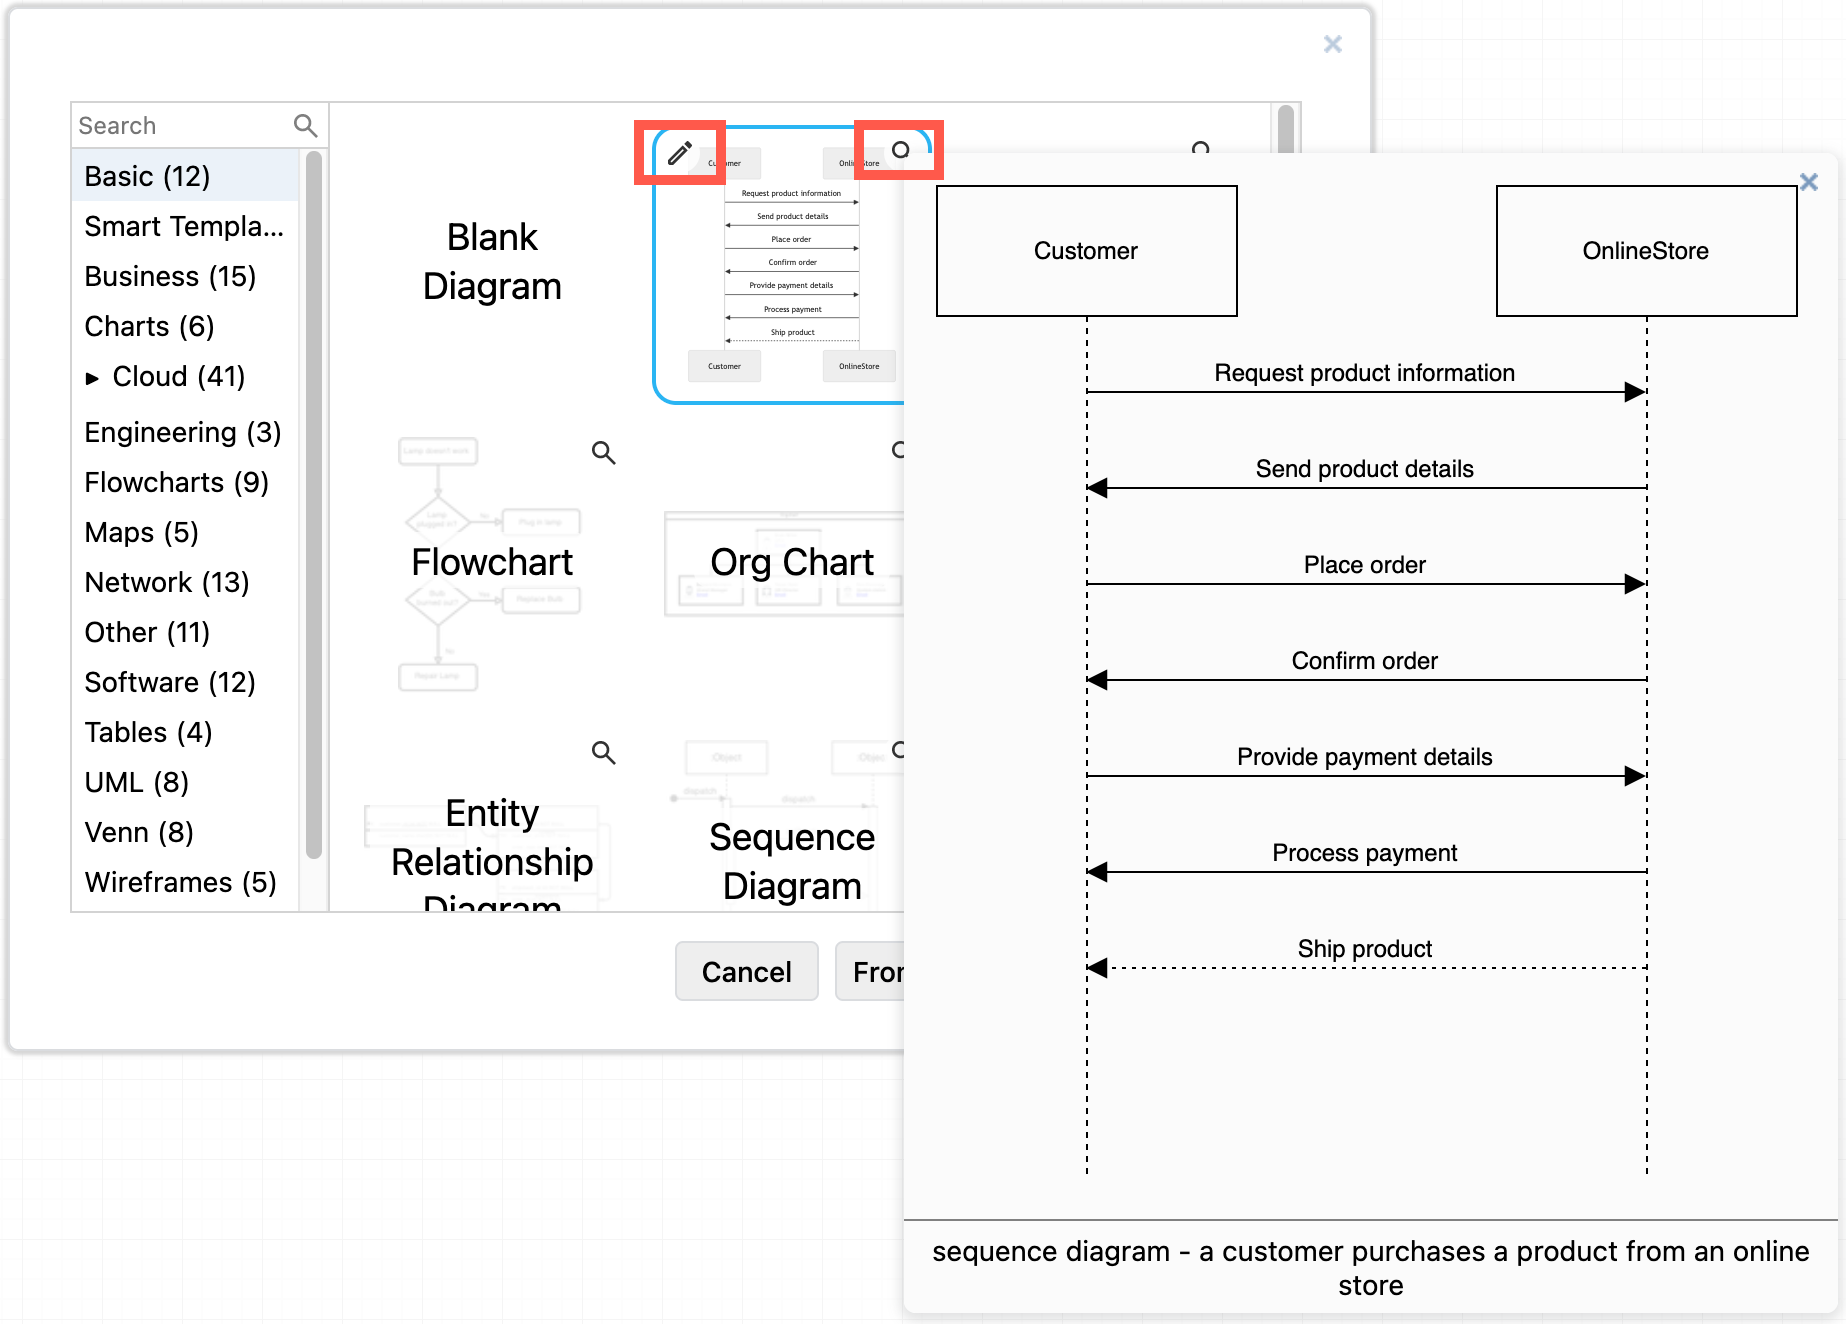
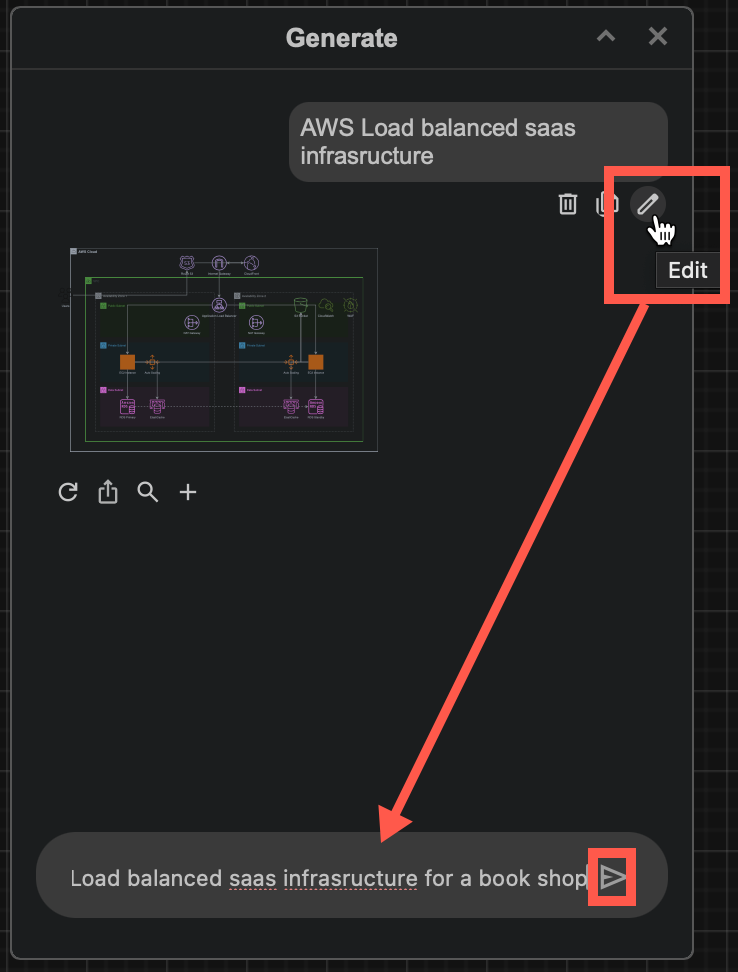
Edit your query: Click the pencil in the top right - and resubmit it to generate a different version of your diagram. Click on the magnifying glass in the top right or hover over the diagram to see a larger preview of your diagram.
If you are in the Generate dialog, click the edit pencil under your query to paste it into the query field and submit the query again to generate another version of your diagram.
Read on for the tips to write better queries and generate better diagrams.
Write the diagram type first
This will tell the generator to limit the diagram type to the one you want. For example, a sequence diagram.
sequence diagram - a customer purchases a product from an online store
Tip: Add vertical or horizontal to tell the generator to draw the diagram in that direction.
Keep the language simple and consistent
Keep your language simple and direct, use punctuation and multiple sentences. Make sure you use the same term to consistently refer to each actor or system in your diagram.
The following examples are increasingly more complex than the prompt used for the sequence diagram above.
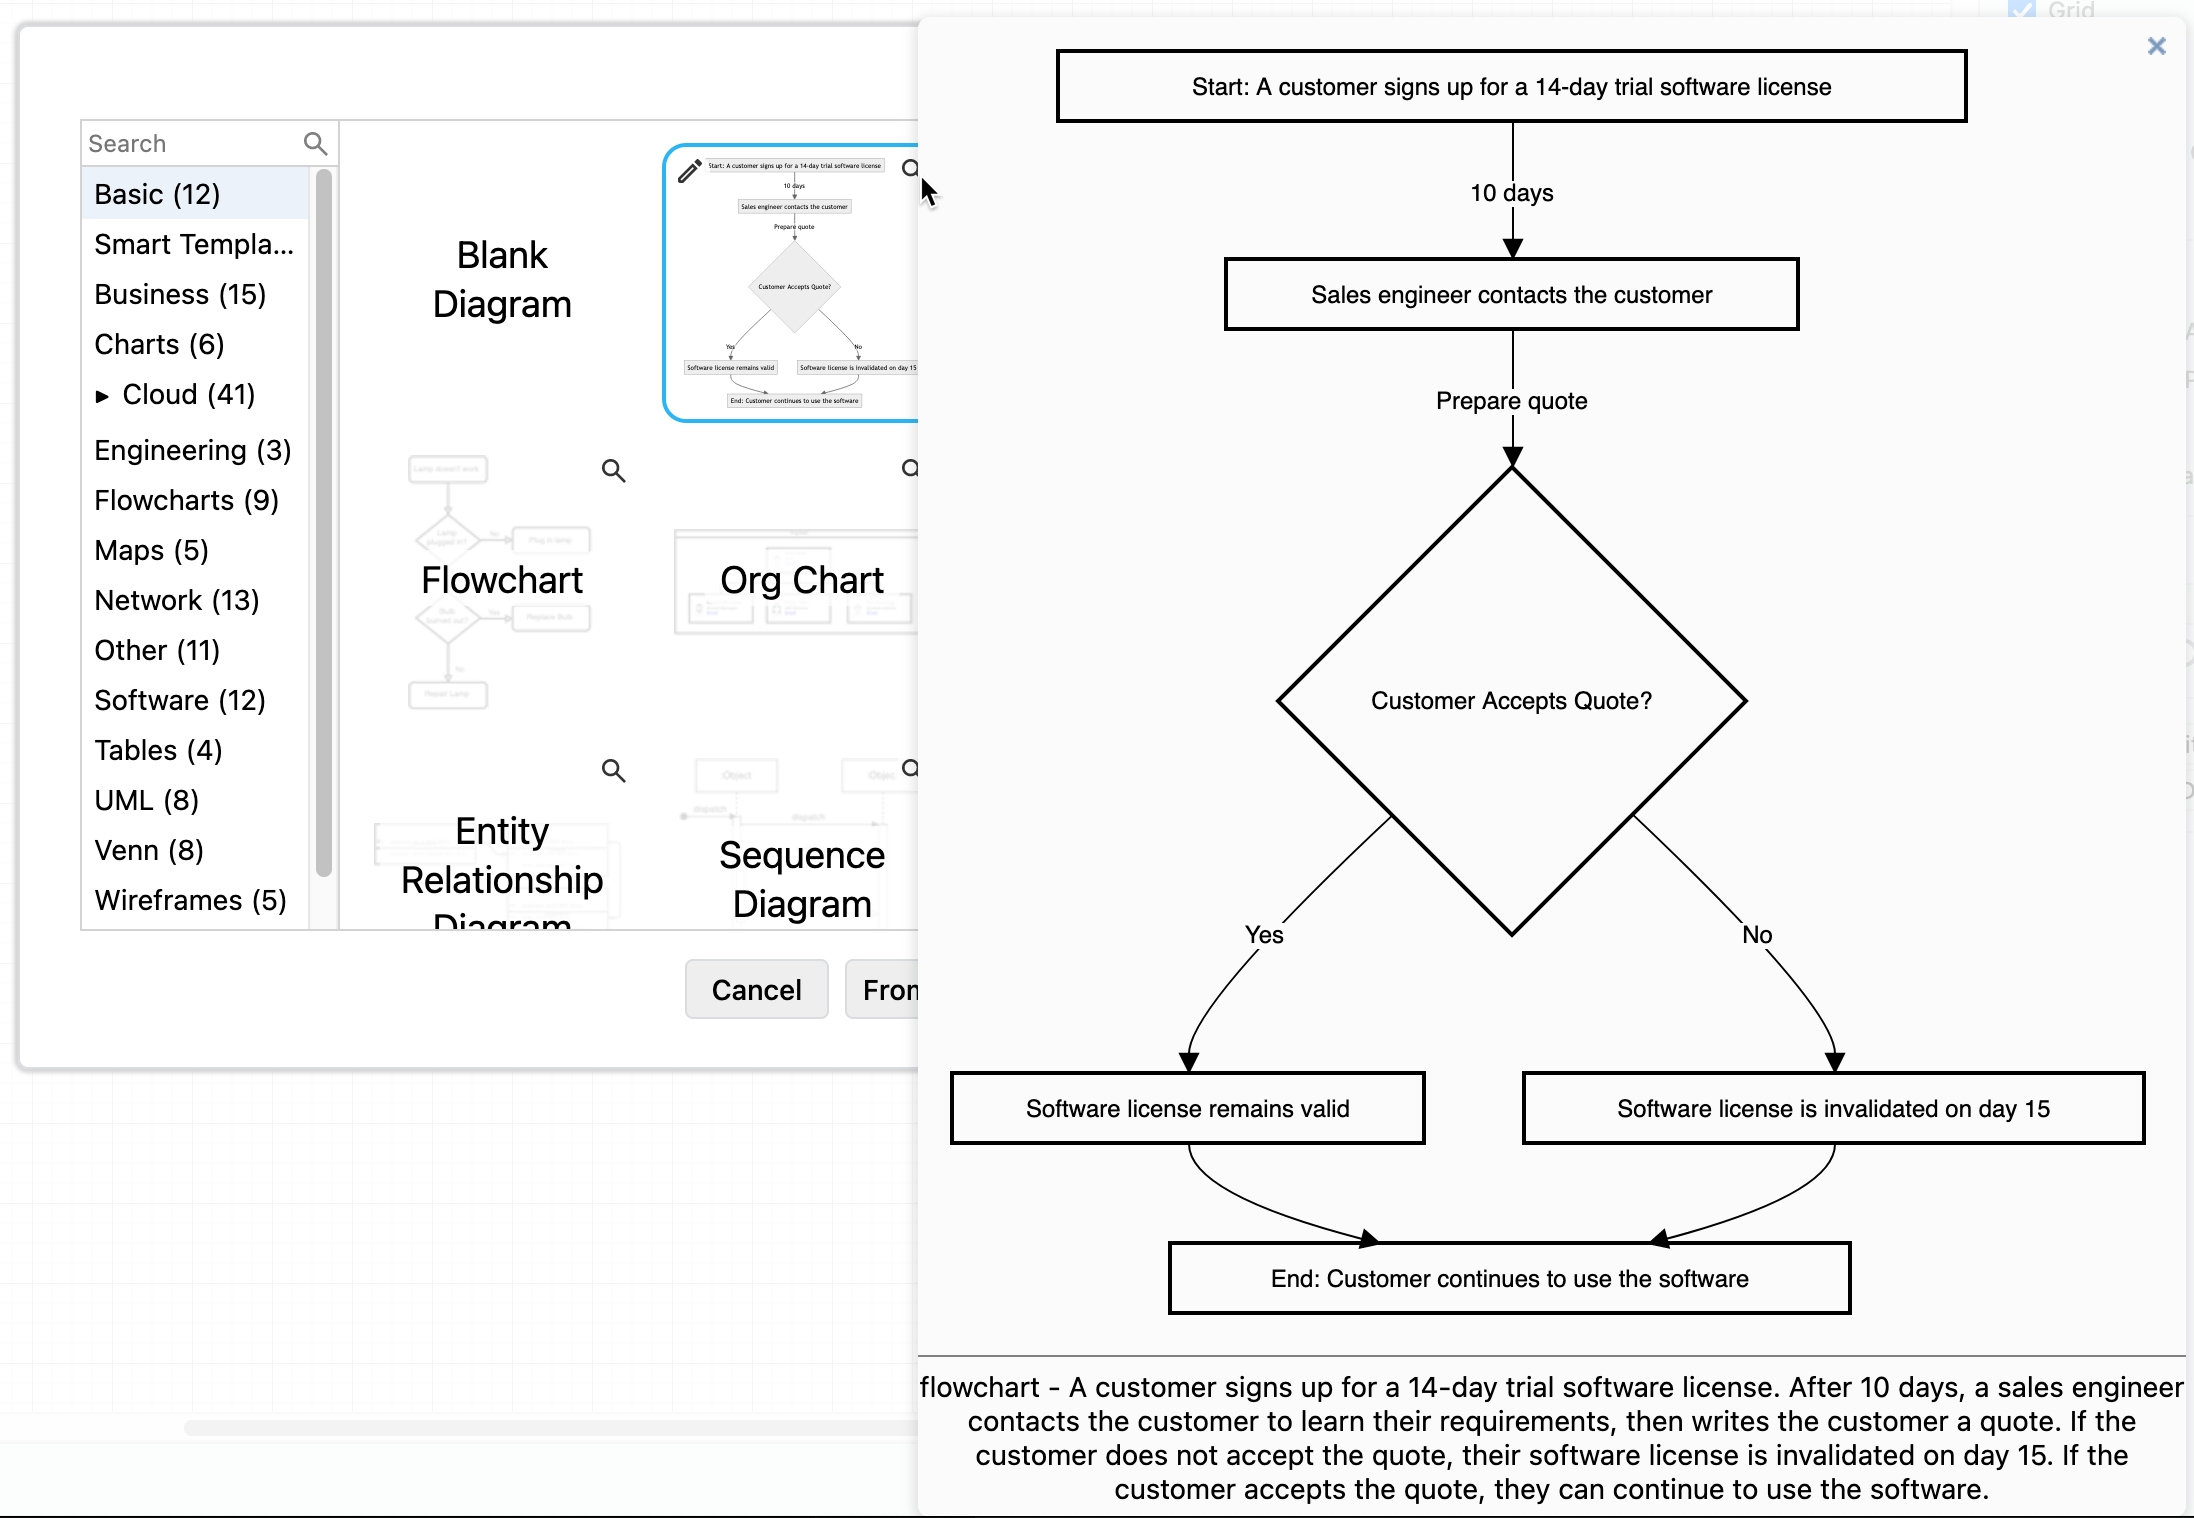
flowchart - A customer signs up for a 14-day trial software license.
After 10 days, a sales engineer contacts the customer to learn their
requirements, then writes the customer a quote.
If the customer does not accept the quote,
their software license is invalidated on day 15.
If the customer accepts the quote, they can continue to use the software.
Add detail for a more accuracy
If you want to have a detailed and appropriate generated diagram and not have to do too much editing to get to your final diagram, you will need to include all the important details.
Using the example above, the customer who chooses not to accept the quote must not be allowed to start another free trial.
vertical flowchart -
A customer signs up for a 14-day trial software license.
Has the customer already had a trial license?
Yes - the customer must contact a sales engineer.
No - Customer can use the software for 14 days.
After 10 days, a sales engineer contacts the customer
to learn the customer's requirements and writes the customer a quote.
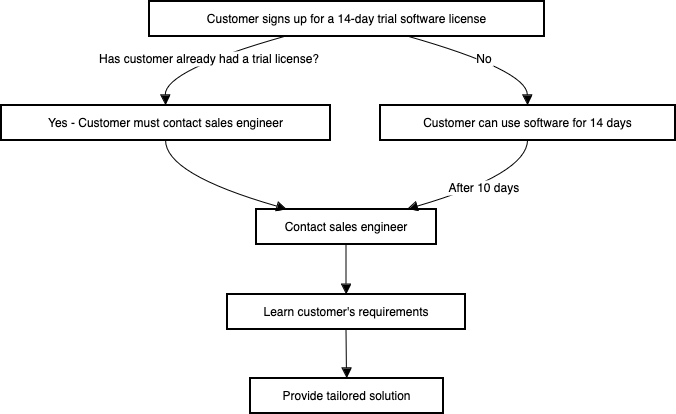
As you can see, generated diagrams - and indeed generated content of all types - almost always need editing. The customer should receive a quote, not a tailored solution.
Break it up into multiple short queries
As the generator only accepts short queries, and ignores anything past a certain length, you’ll need to break your description into parts and add multiple generated diagrams to the drawing canvas.
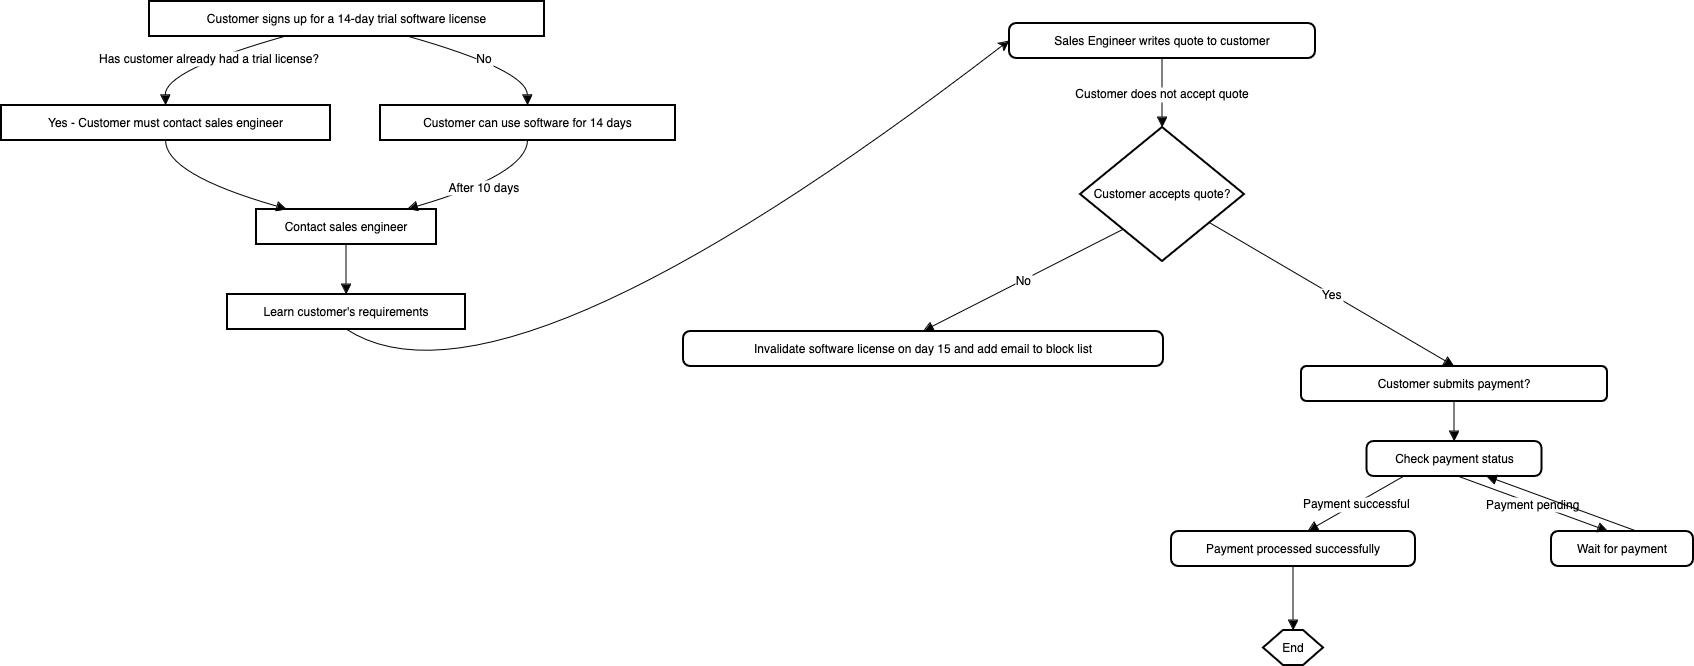
For example, let’s remove the tailored solution step from the previous example, and insert a second second generated diagram for the remaining steps in the process.
vertical flowchart -
The sales engineer writes a quote to the customer.
If the customer does not accept the quote,
their software license is invalidated on day 15
and their email address is added to a block list.
If the customer accepts the quote, and payment is
processed successfully, they can continue to use the software.
Open this example in the draw.io viewer
Use terms from the Mermaid syntax
As the generator outputs a diagram using Mermaid syntax, you can get better results when using the terms from the Mermaid syntax documentation to describe its diagrams. For example, user journeys are broken into sections which contain tasks that have a happiness value.
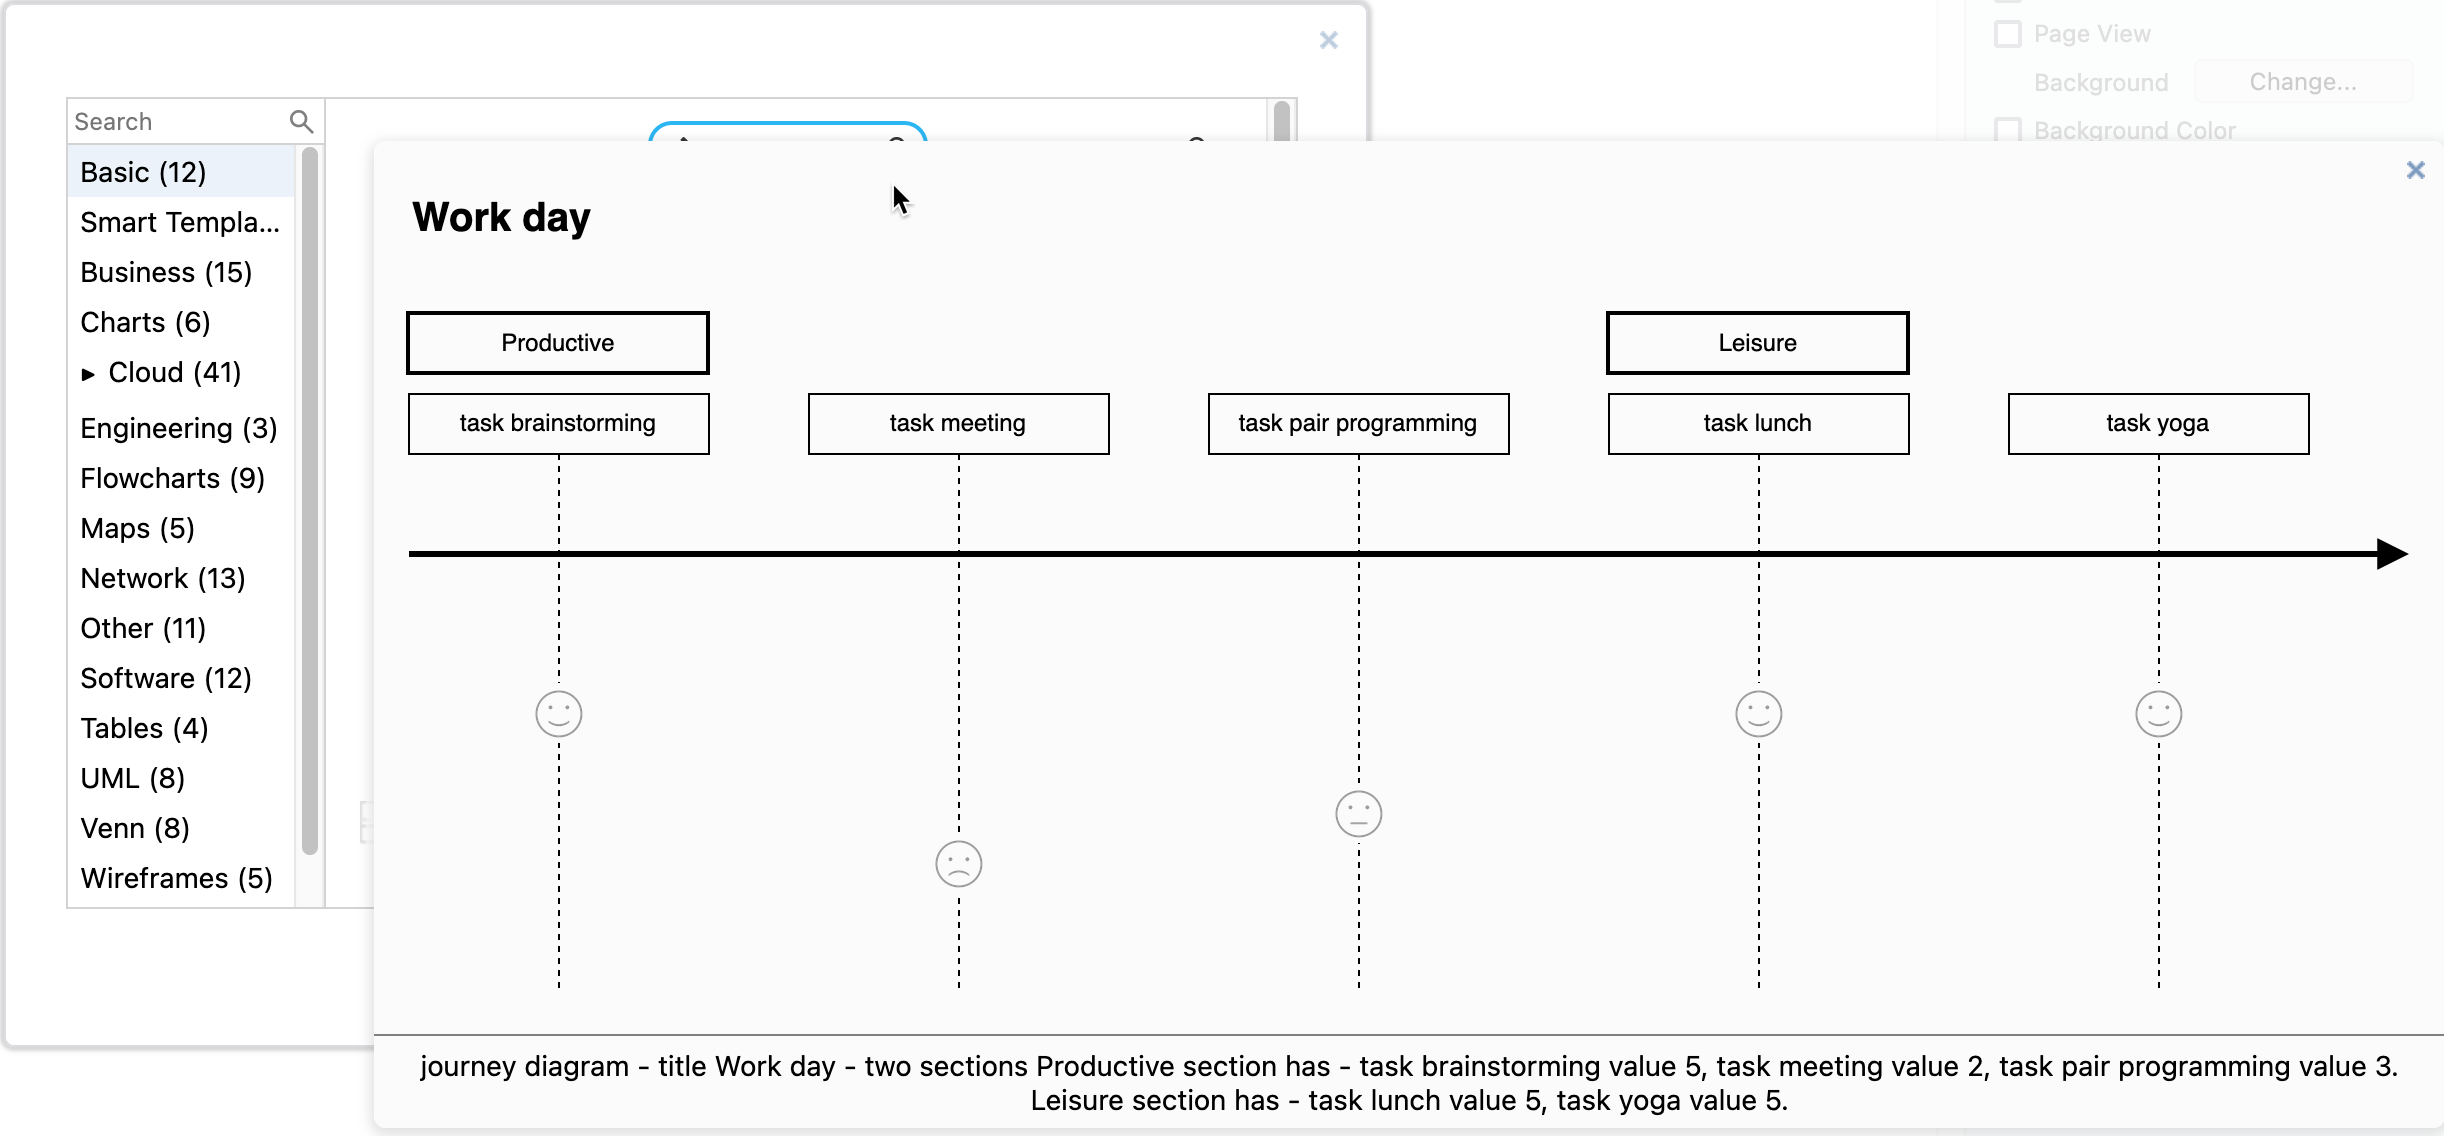
journey diagram - title Work day - two sections

Productive section has - task brainstorming value 5,
task meeting value 2, task pair programming value 3.

Leisure section has - task lunch value 5, task yoga value 5.
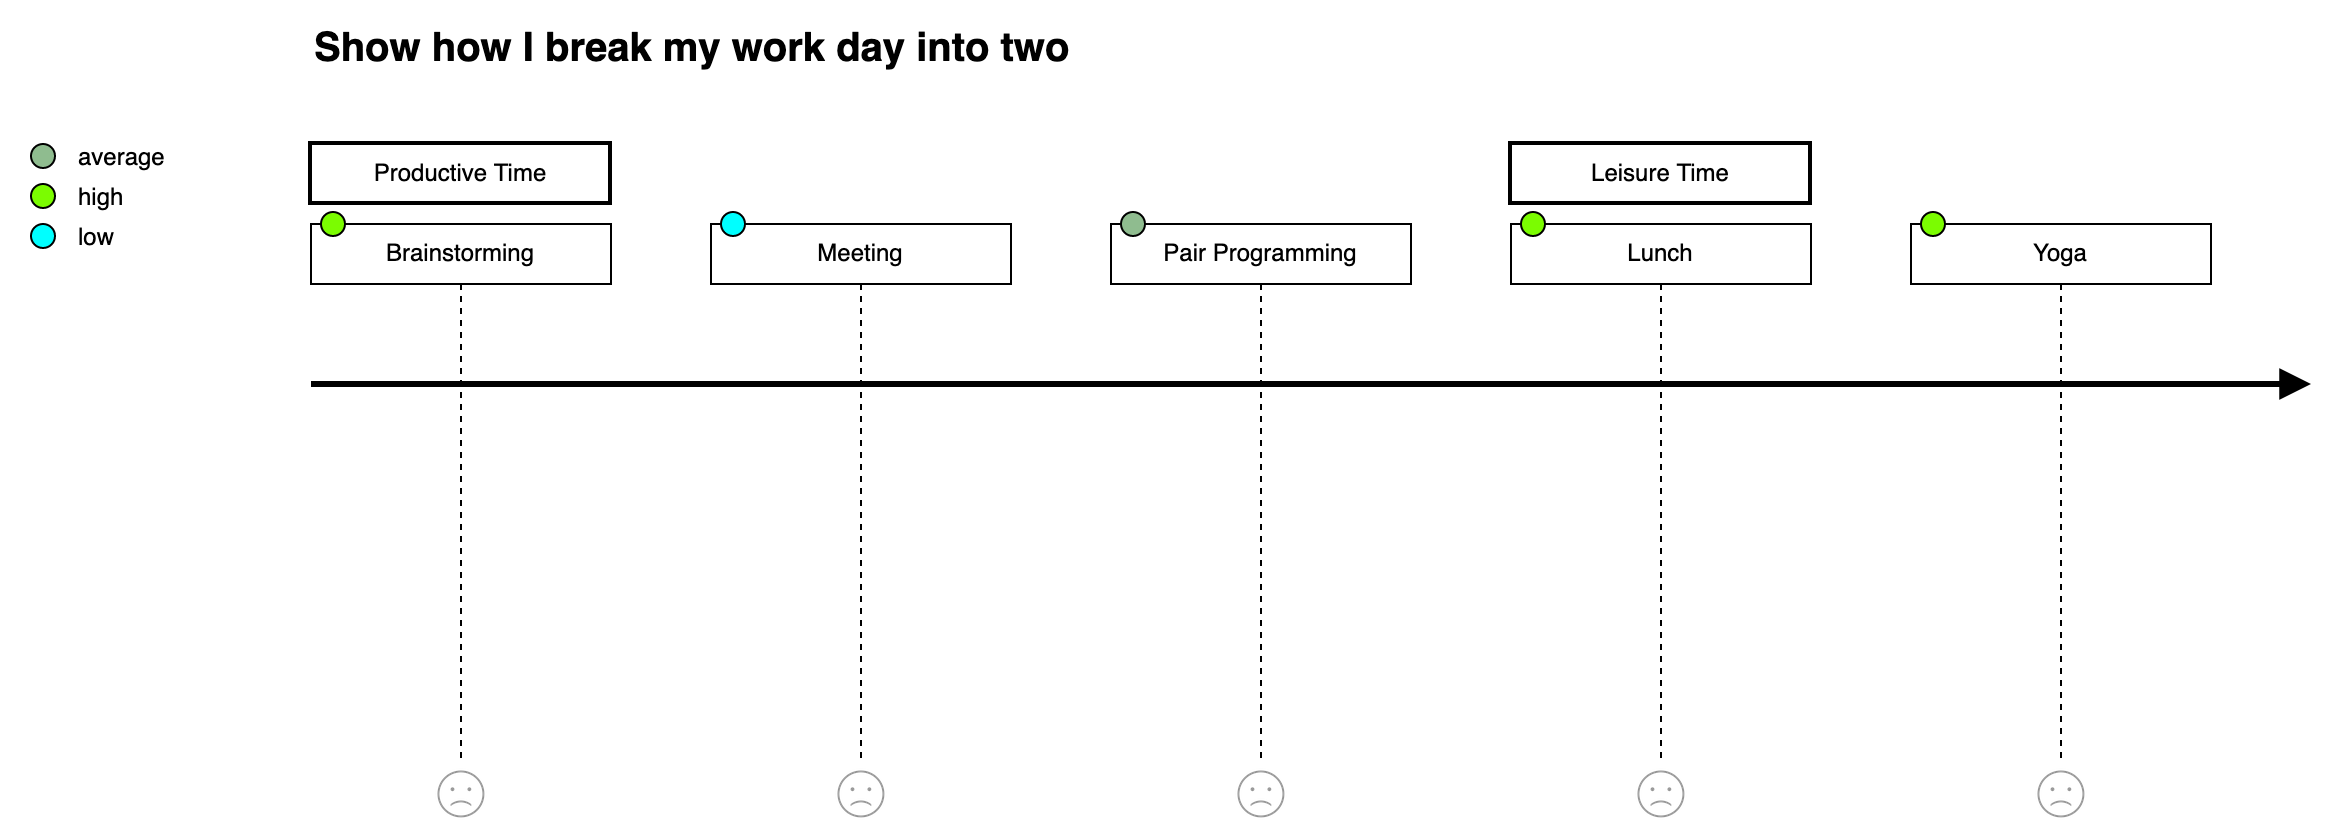
Compare this to a more natural description of the rating system - using high, average and low instead of numerical values.
journey - Show how I break my work day into two.
When I'm productive, I rate brainstorming high, meeting low
and pair programming average, and in my leisure time, I have
lunch and do yoga, and rate both highly