Updated Citrix shape library for clean infrastructure diagrams
The new Citrix shape library helps you to draw Citrix diagrams of complex infrastructures that are easier to read. The older 3D shapes are still available in the Citrix (legacy) shape library.

Citrix is a popular secure centralised platform for deploying applications, desktops and virtual solutions to devices in large enterprises with locations distributed worldwide, especially where high availability and scalability is required.
Learn more about drawing infrastructure and network diagrams
Enable the new Citrix shape library in draw.io
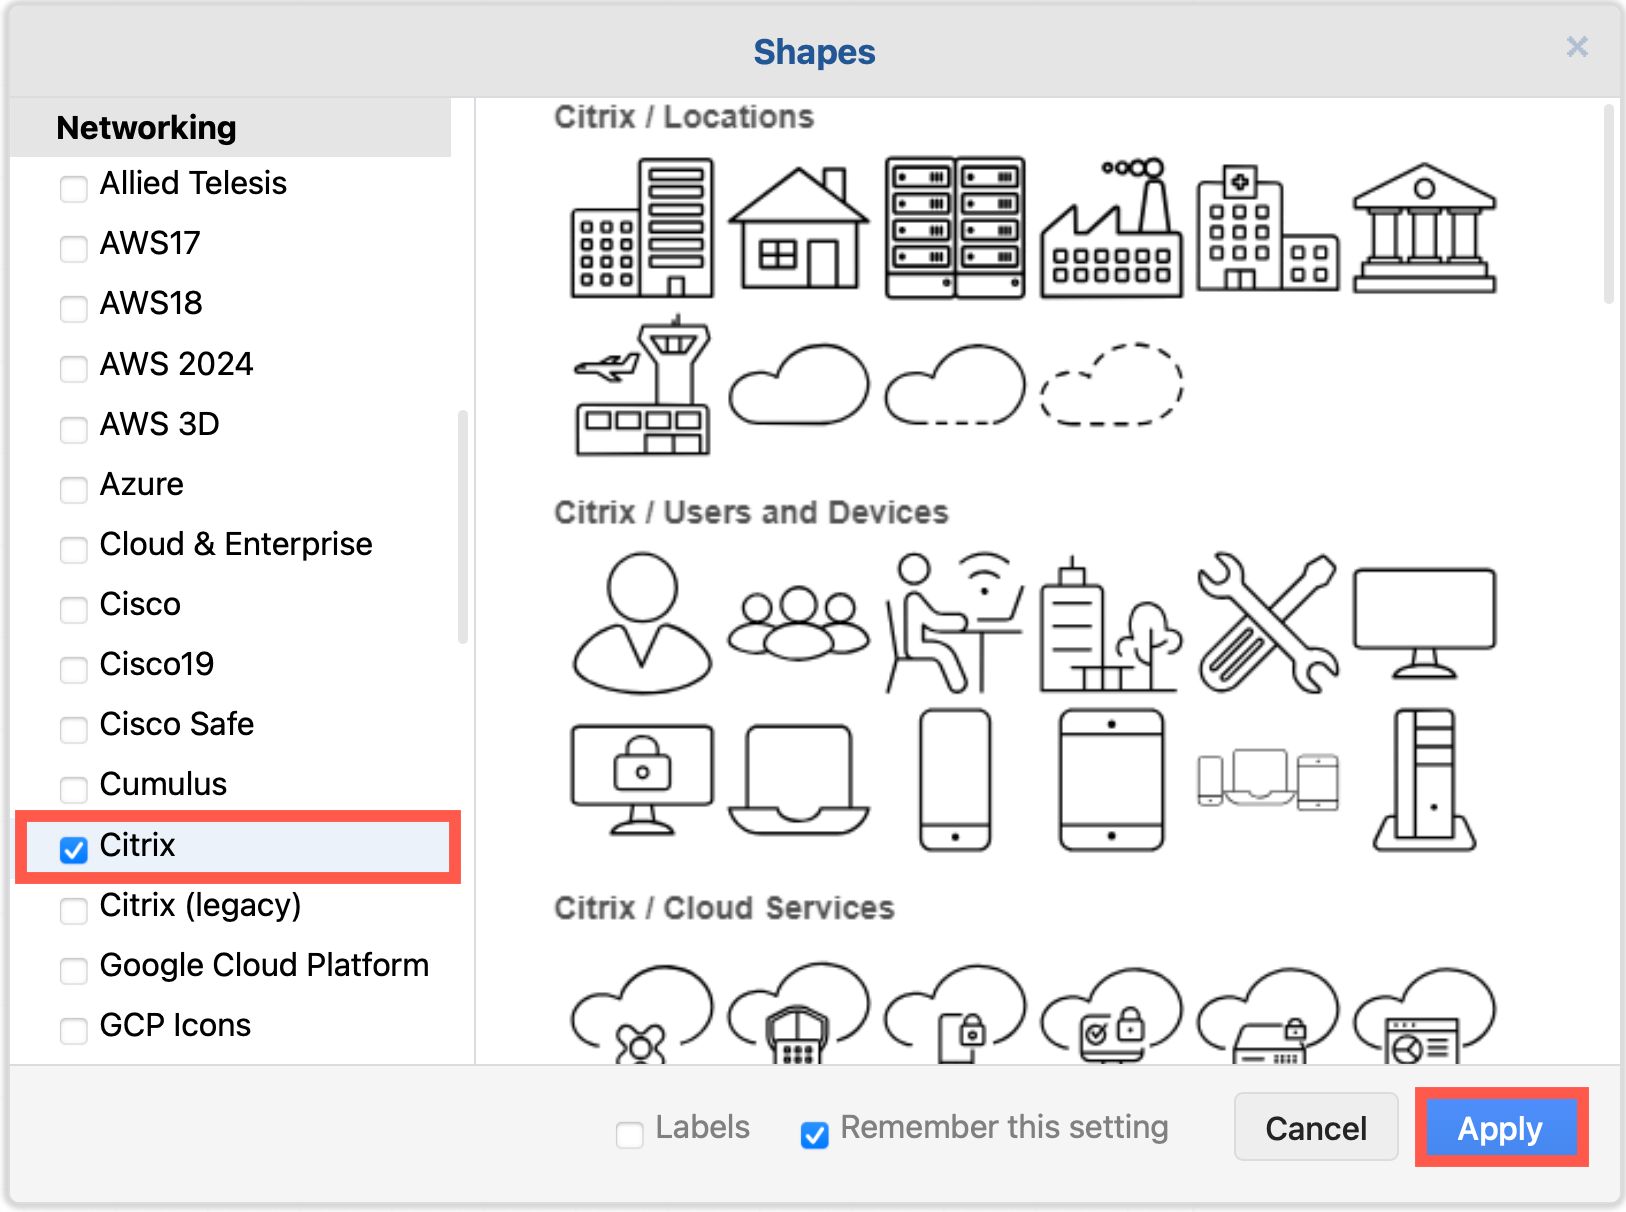
- Click on More Shapes at the bottom of the shapes panel in draw.io.
- Enable the checkbox next to the SAP shape library in the Networking section and click Apply.
Citrix infrastructure diagram tips
-
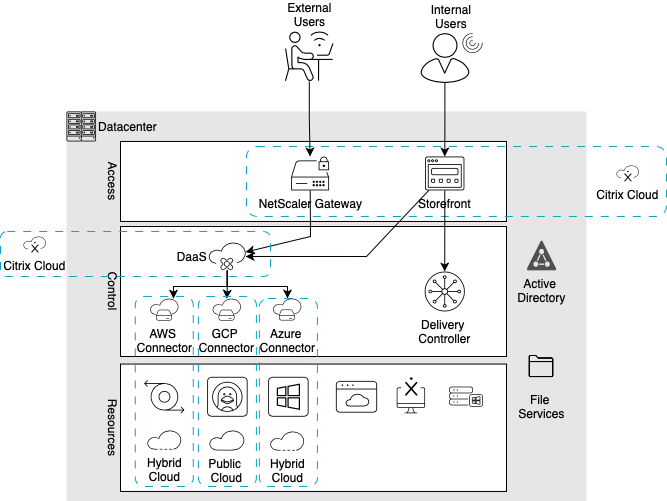
Use regions to visually group segments, security zones, and workloads. A simple rectangle placed behind a group of systems or services is the simplest option. You could also use collapsible container shapes or AWS groups.
-
Use shape fill colours and outline styles consistently to visually indicate regions, types and grouping of services or tools, or show which teams are responsible for maintaining those infrastructure areas.
-
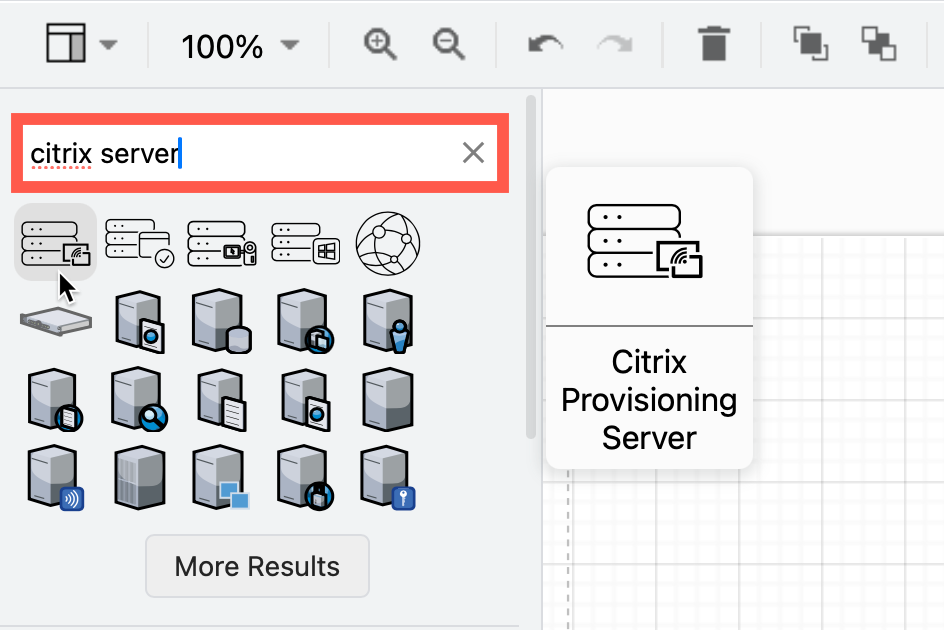
Use application, device and platform logos where possible. Search for these by name in the top left of the shapes panel in draw.io. Hover over any shape to see a larger preview.
-
Add a legend if necessary. This is especially important when working with external parties, as they may not be familiar with all the components in your infrastructure.
-
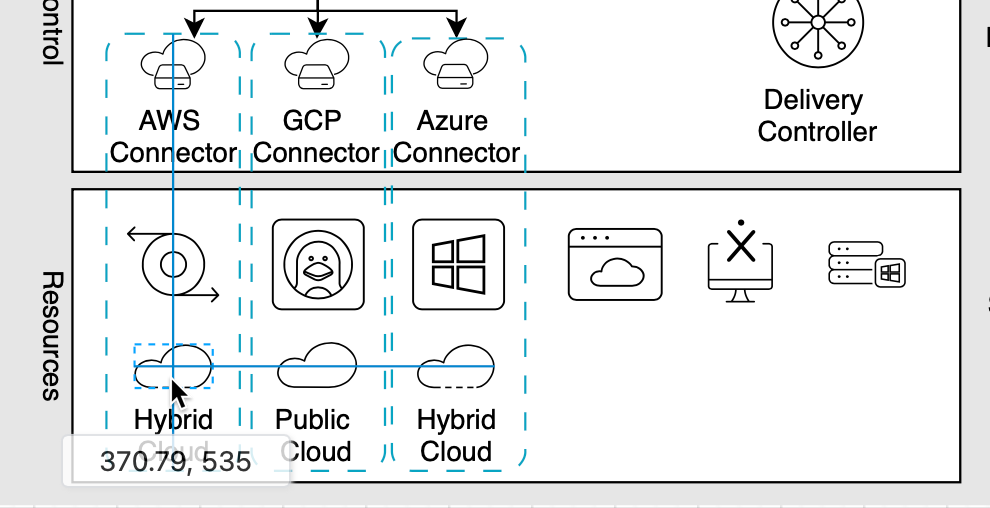
Align shapes using the blue guidelines that appear as you move them around the drawing canvas.
-
To group shapes once you have drawn a subsystem and placed it in a region, drag a selection box around all the shapes, right-click and select Group from the context menu. Now you can move the group without losing its internal layout.
Draw multi-platform infrastructure diagrams
Enable the AWS, Google Cloud Platform and Azure shape libraries in draw.io to document your multi-environment infrastructure.
You can use the up-to-date shapes in the AWS groups, GCP Zones and cards from the Google Cloud Platform libraries to indicate different regions. Alternatively, place an identifying shape in the top left corner of a basic rectangle shape, move the shape label to the right and position it neatly with custom spacing.
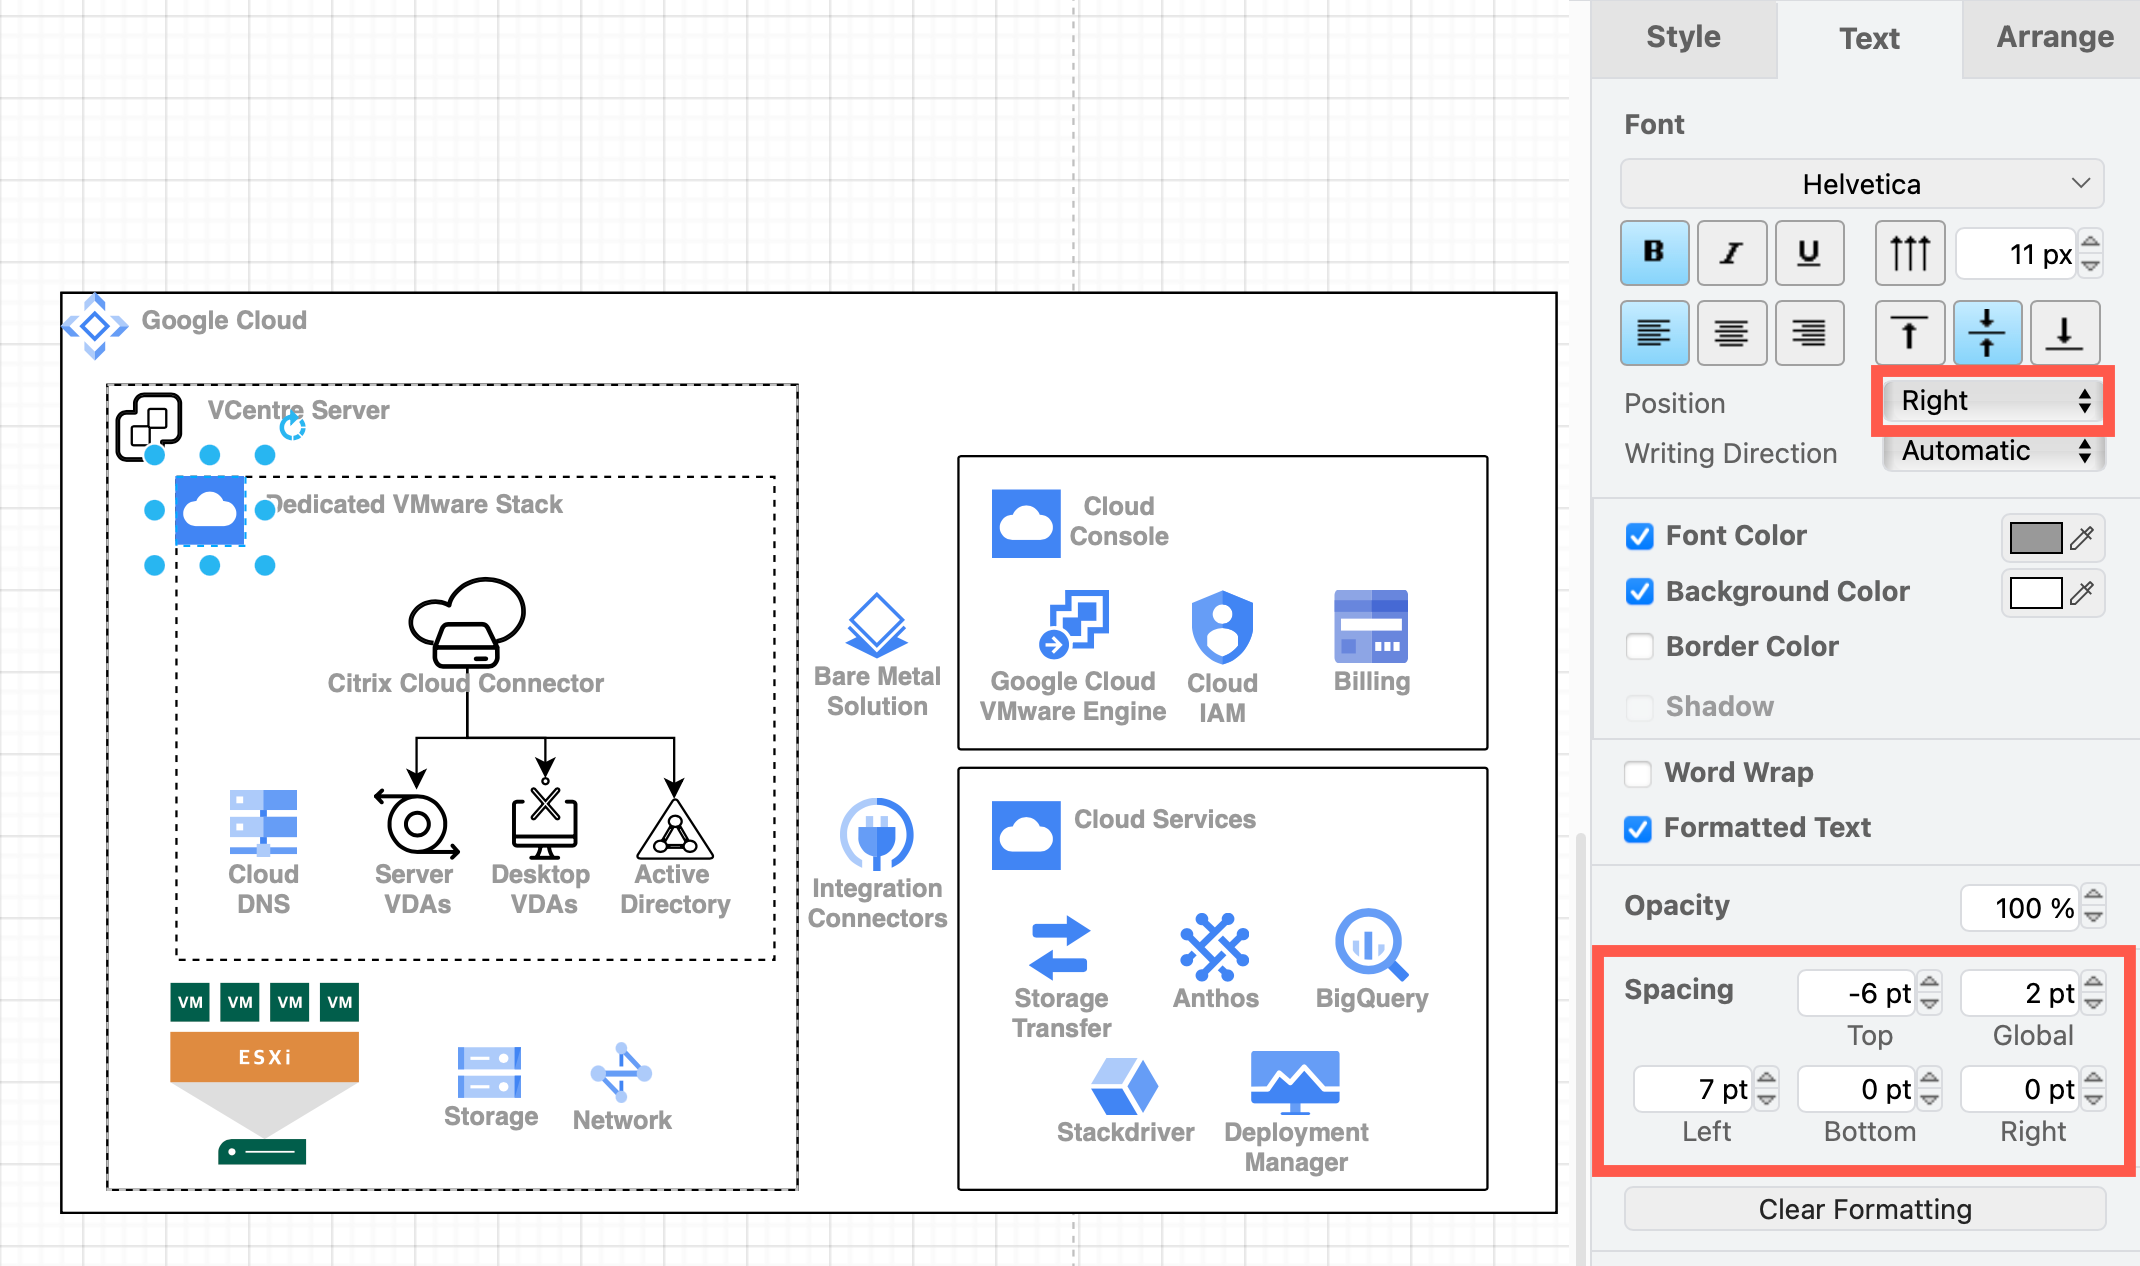
This will let you show how sub-systems are isolated and confined to each region in your cloud platforms and how loads are distributed when using the Citrix Hybrid Multi-Cloud.
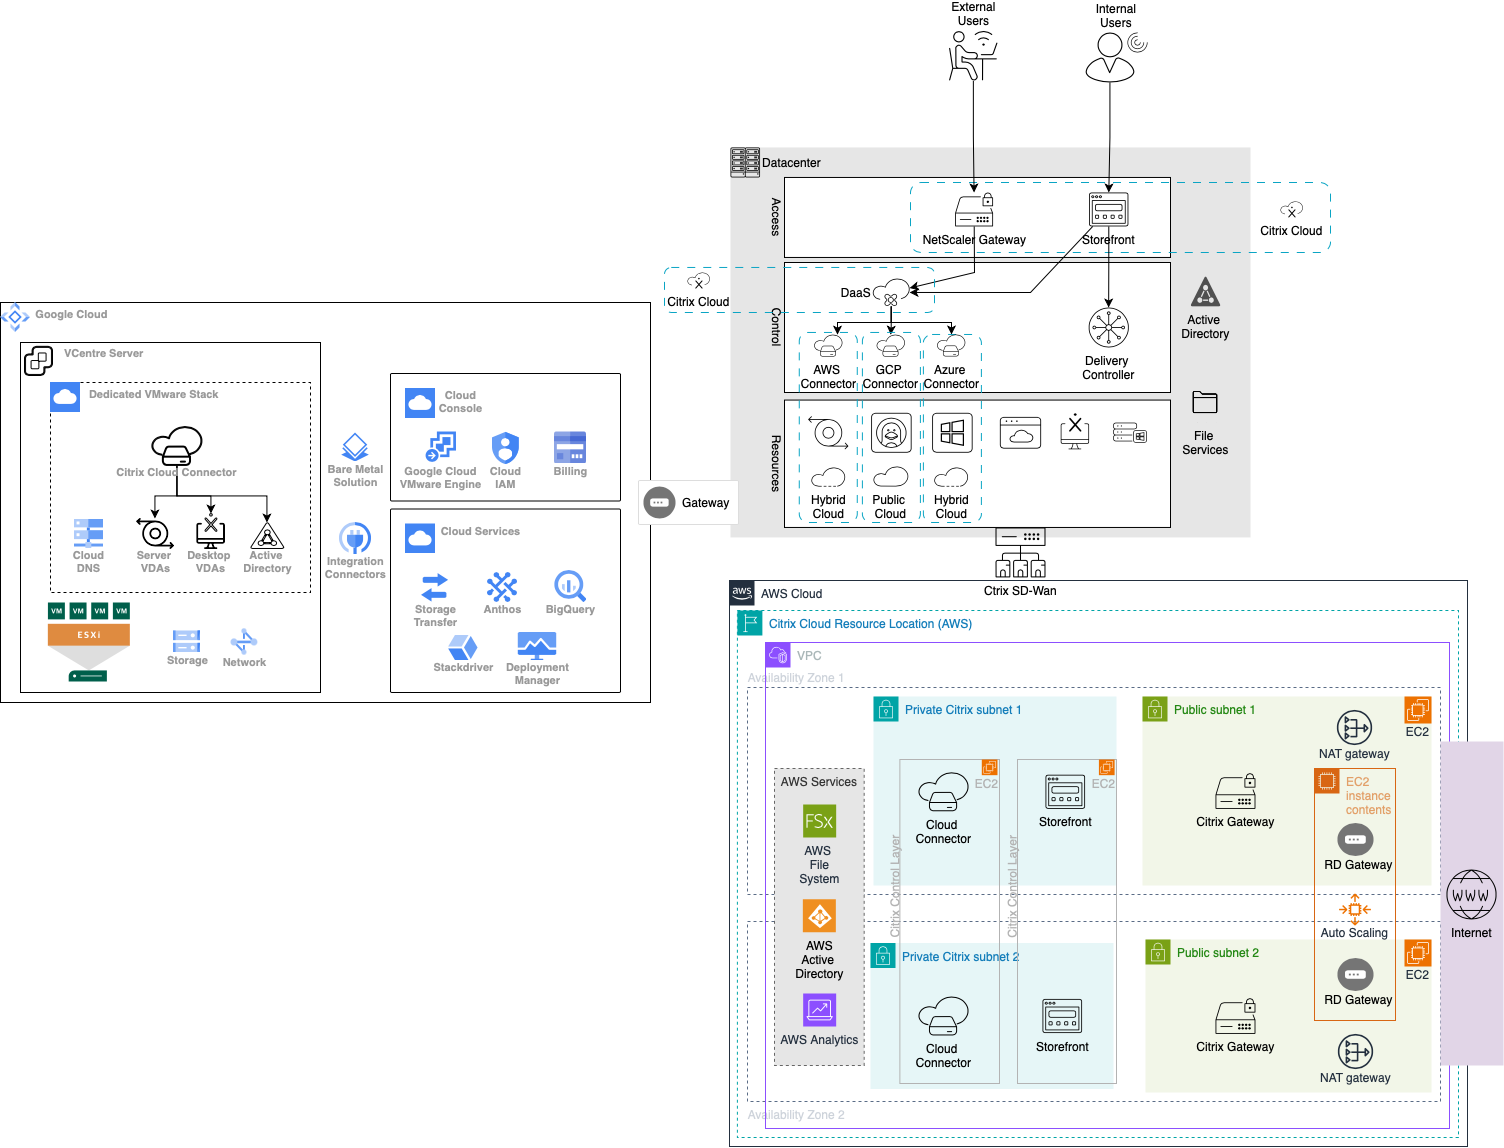
Open this example in the diagram viewer
Related
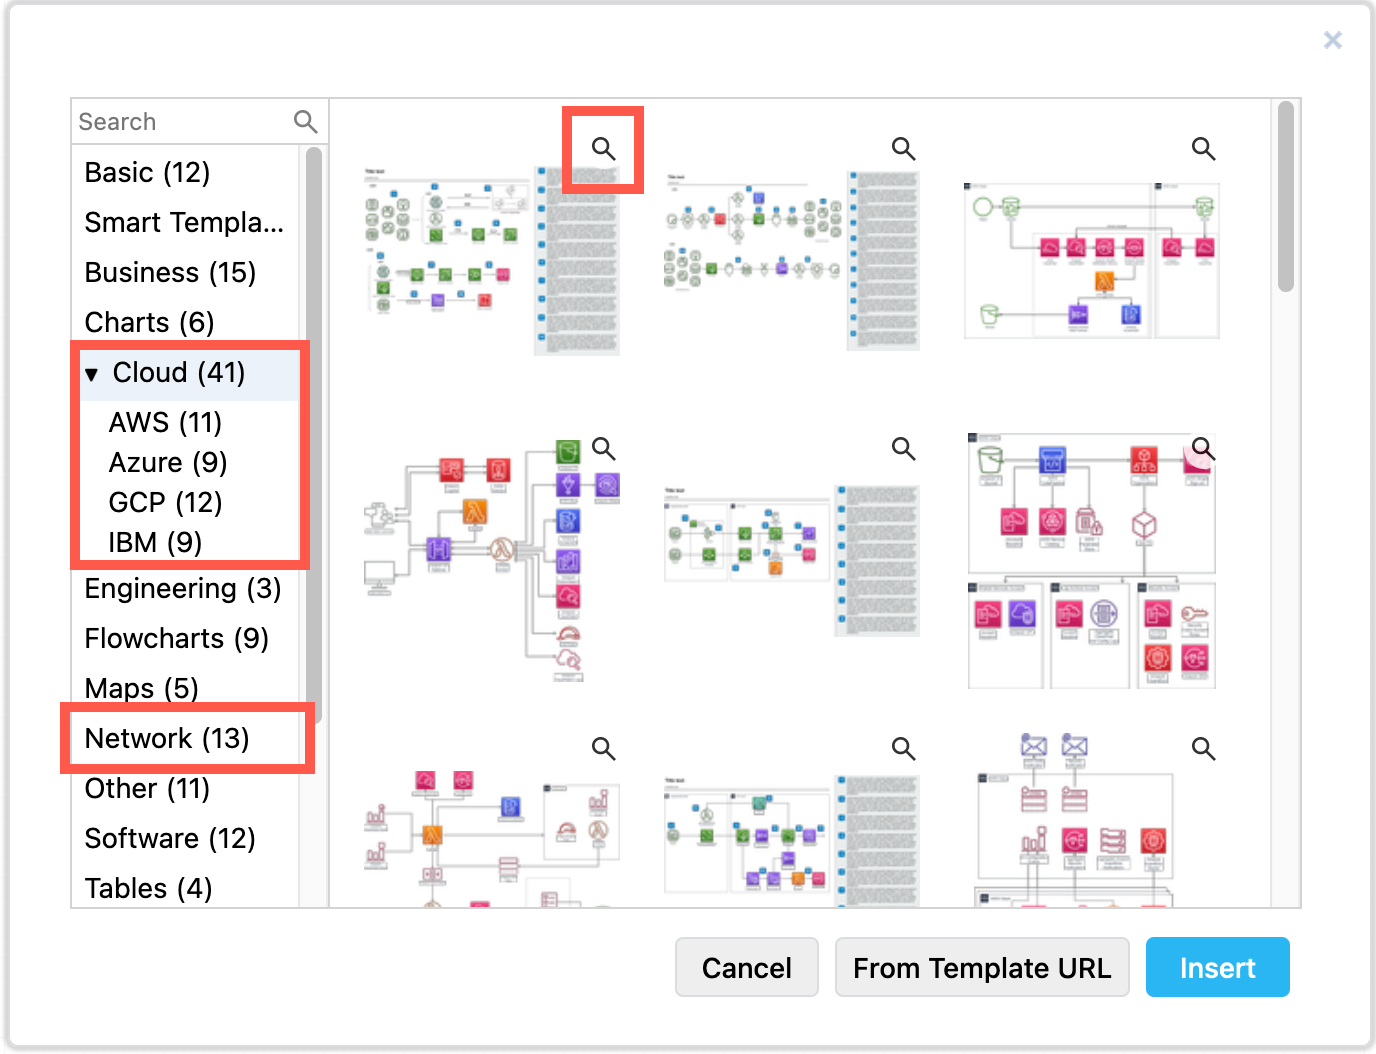
Basic infrastructure templates are under Cloud and Network in the template library. Select Arrange > Insert > Template from the menu or click + > Template in the toolbar.
Additional examples are in the drawio-diagrams repository on GitHub. Check for cloud and network templates, and more detailed examples. You can import a diagram into draw.io as a template using its raw GitHub URL.
Some platforms can automatically generate AWS, GCP or Azure diagrams of your implemented infrastructure. Cloudcraft and Cloudockit can export to the .drawio or .vsd formats. Select File > Import from or drag and drop this file onto the drawing canvas to import the diagram of that sub-infrastructure.