What can you do with shape data in diagrams?
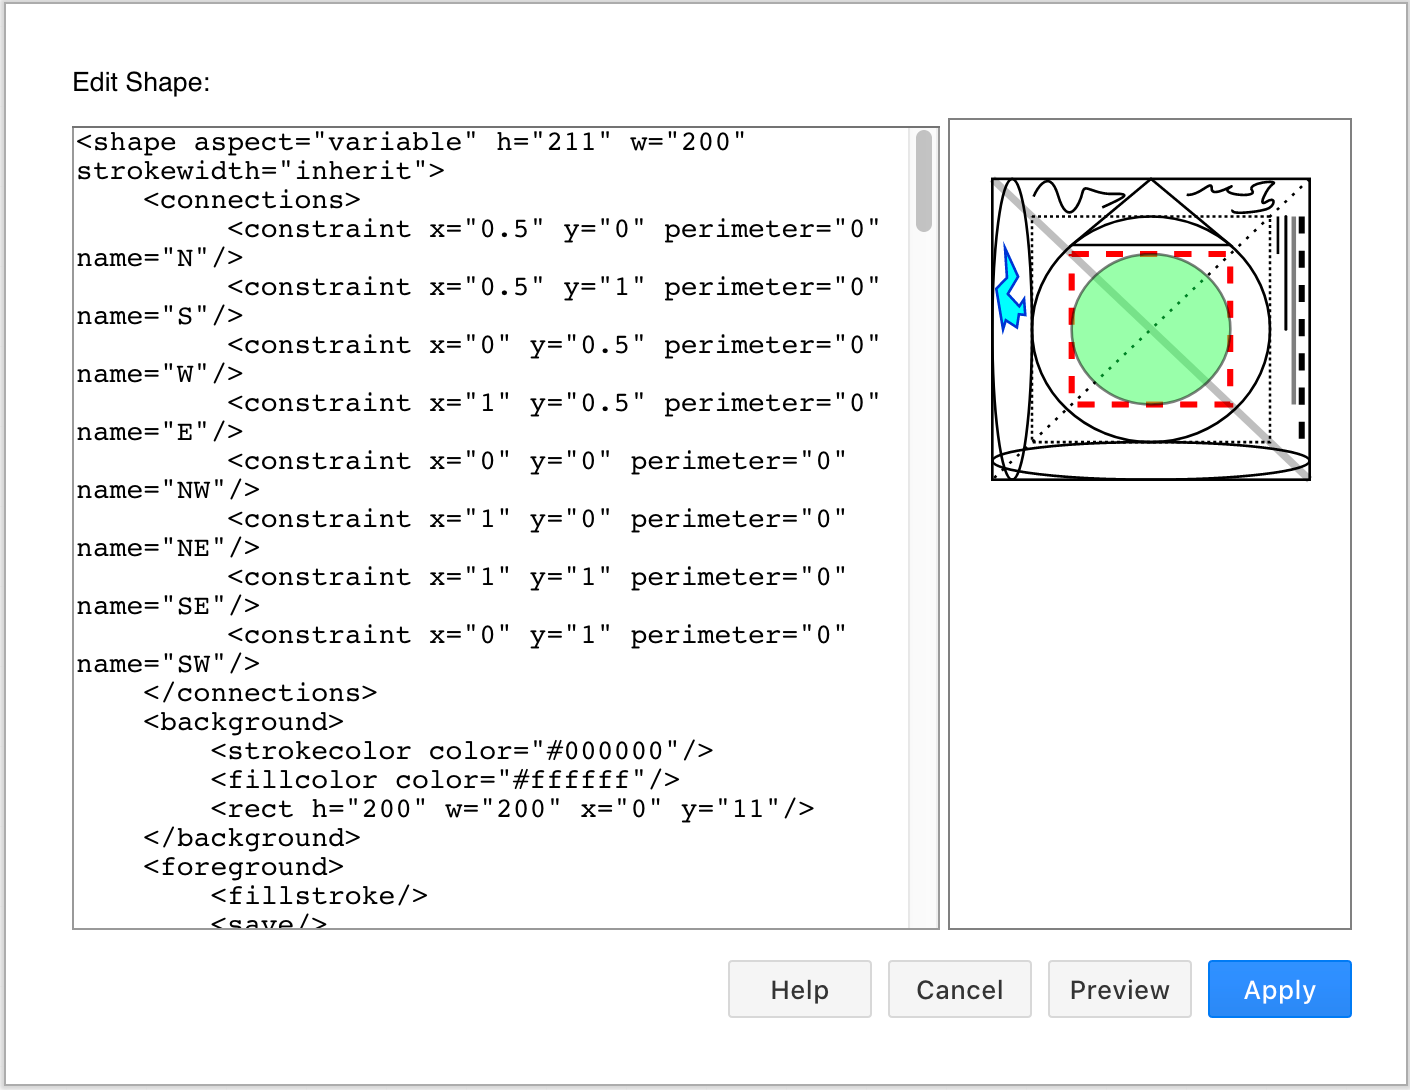
The shapes, connectors and text elements in your diagram are described in XML - their sizes, locations, groupings, shape styles, z-order on the drawing canvas, and how they are connected to each other. You can attach much more information than this to create richer diagrams and interactivity, including tags, tooltips, links, custom shape properties and more.
Use shape data for richer diagrams
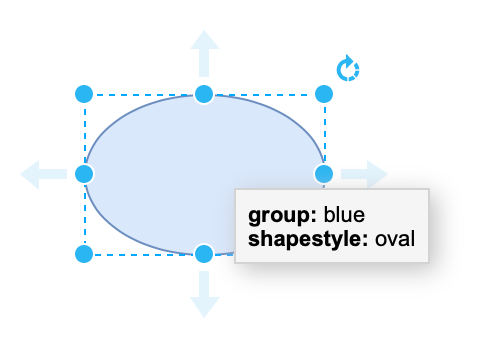
Additional shape data can be used in many different ways.
- Point your audience to additional information via links.
- Add notes in tooltips.
- Add interactivity with tags or custom links.
- Use custom properties with placeholders to automatically update shape styles, labels or tooltips based on other diagram elements.
Edit shape data
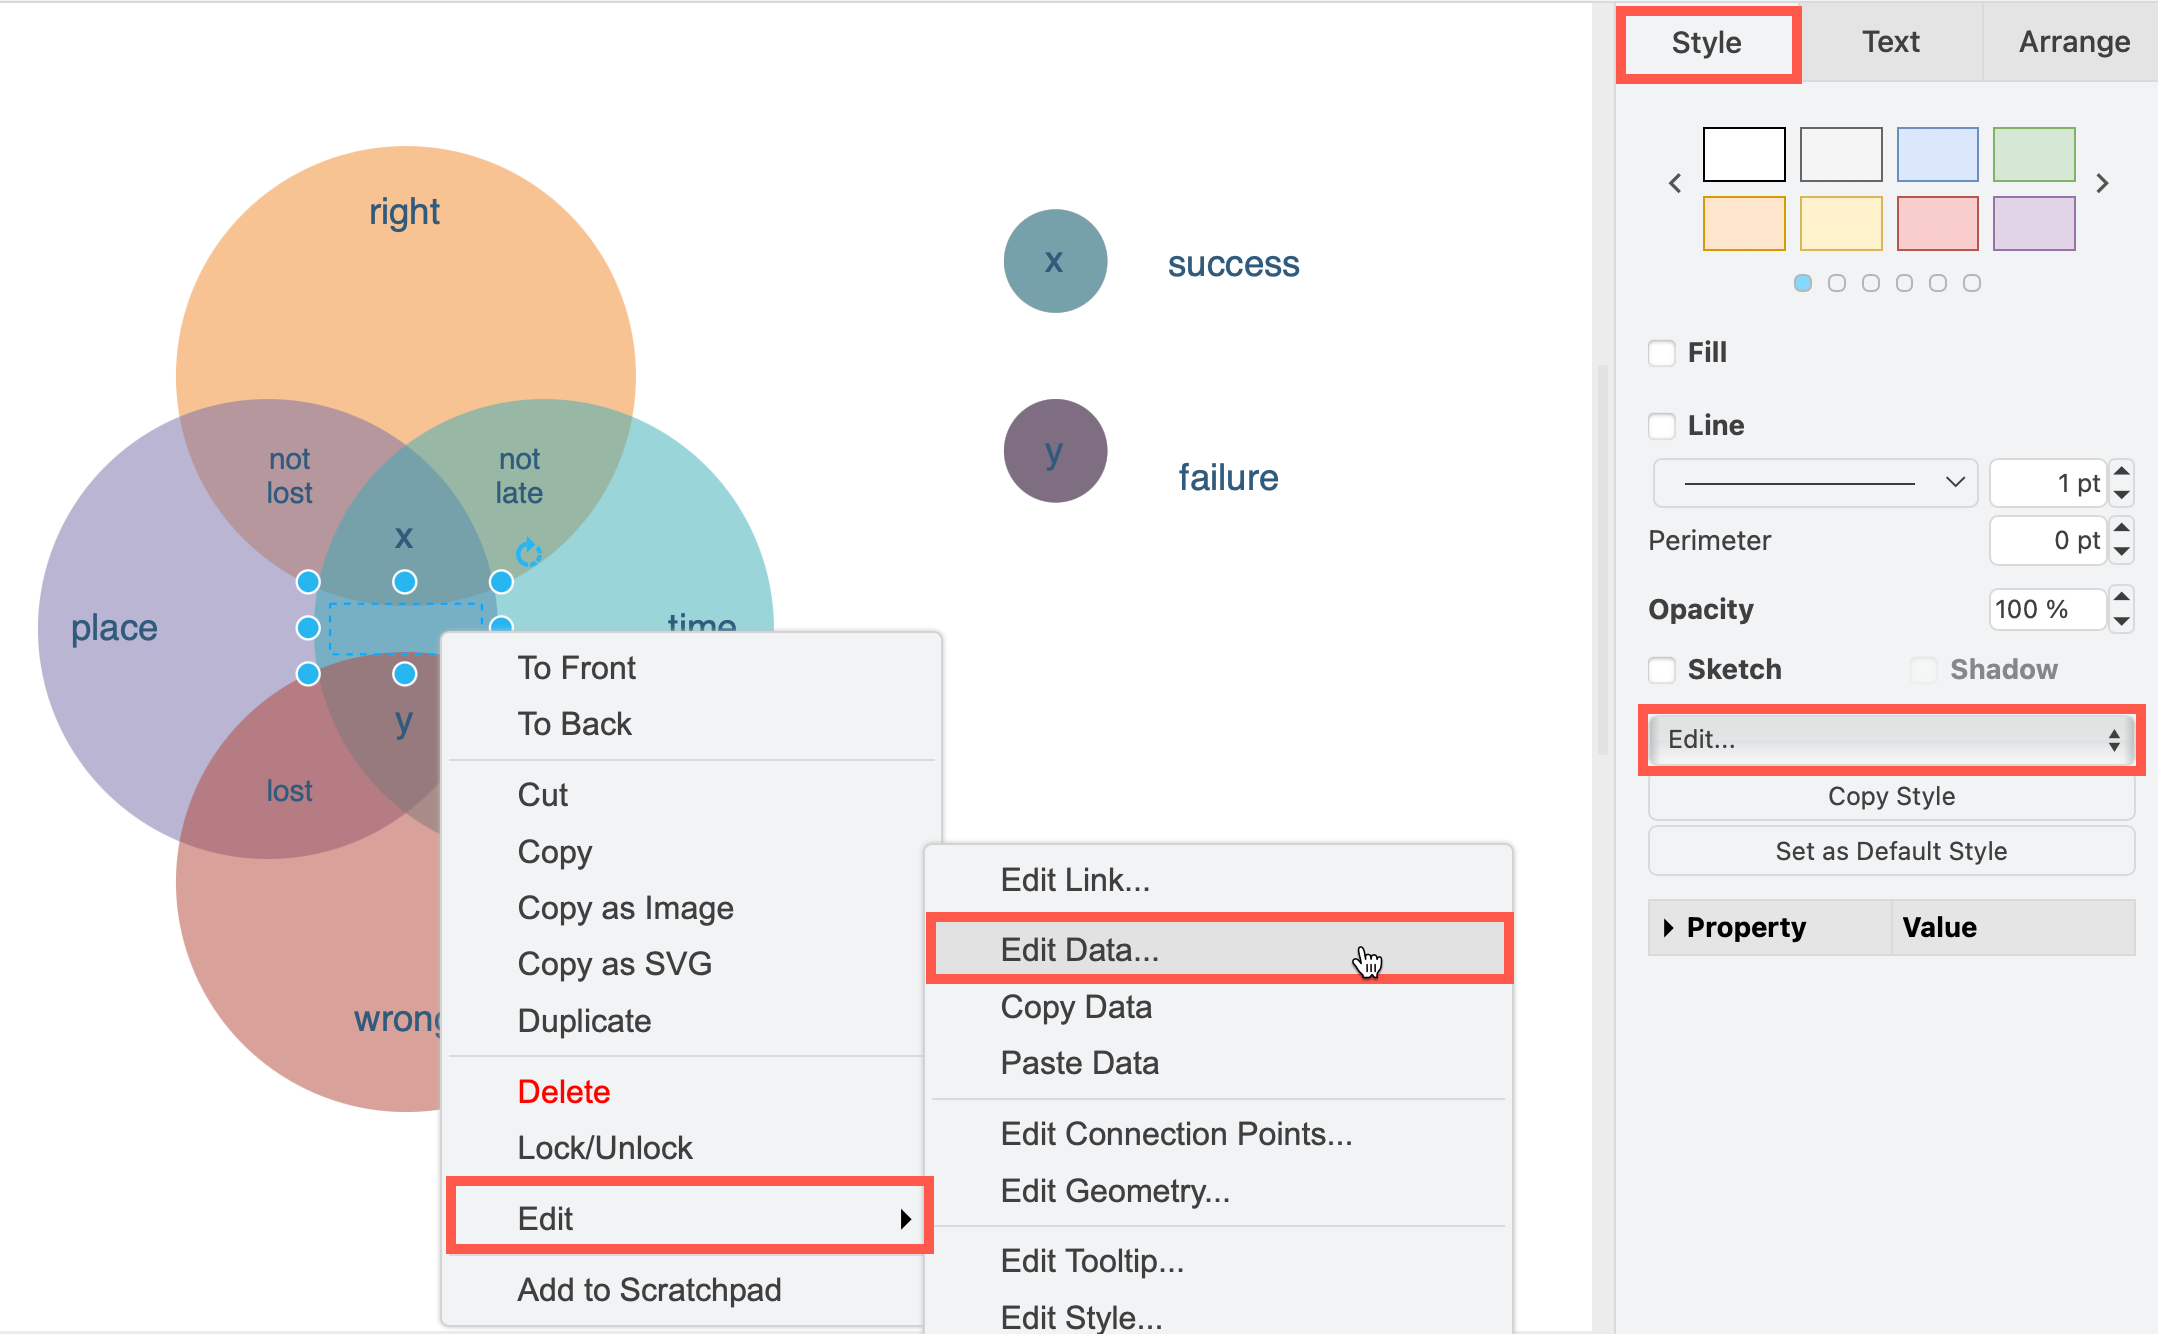
To see a selected shape’s metadata, press Ctrl+M on Windows, or Cmd+M on macOS.
Alternatively, on the Style tab in the format panel on the right, Select Edit > Edit Data from the list, or right-click on a shape and select Edit > Edit Data from the context menu, or select Edit > Edit Data from the editor menu.
In the shape properties dialog, you can add and edit the extra information attached to that shape.
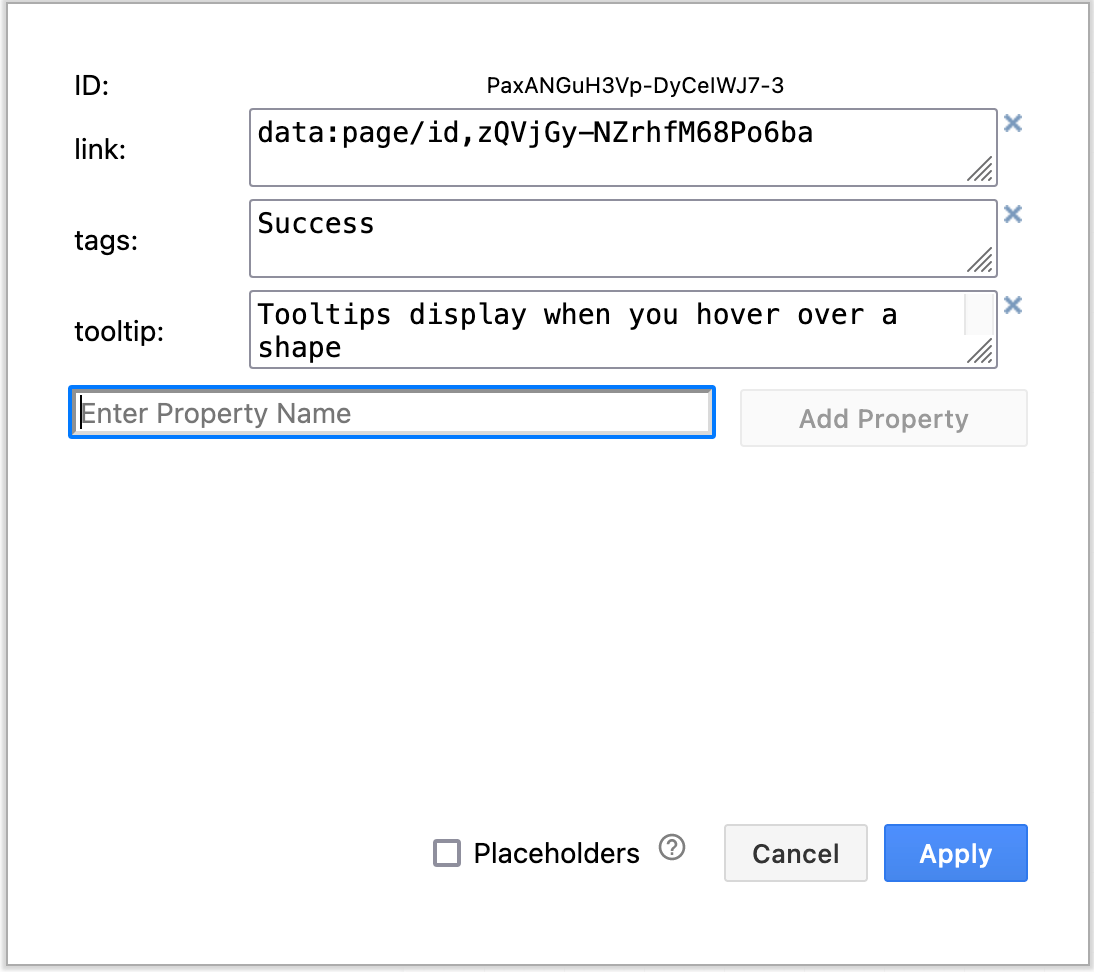
In the example above, the shape has a link, a tag and a tooltip.
Learn how to use shape metadata in the draw.io editor
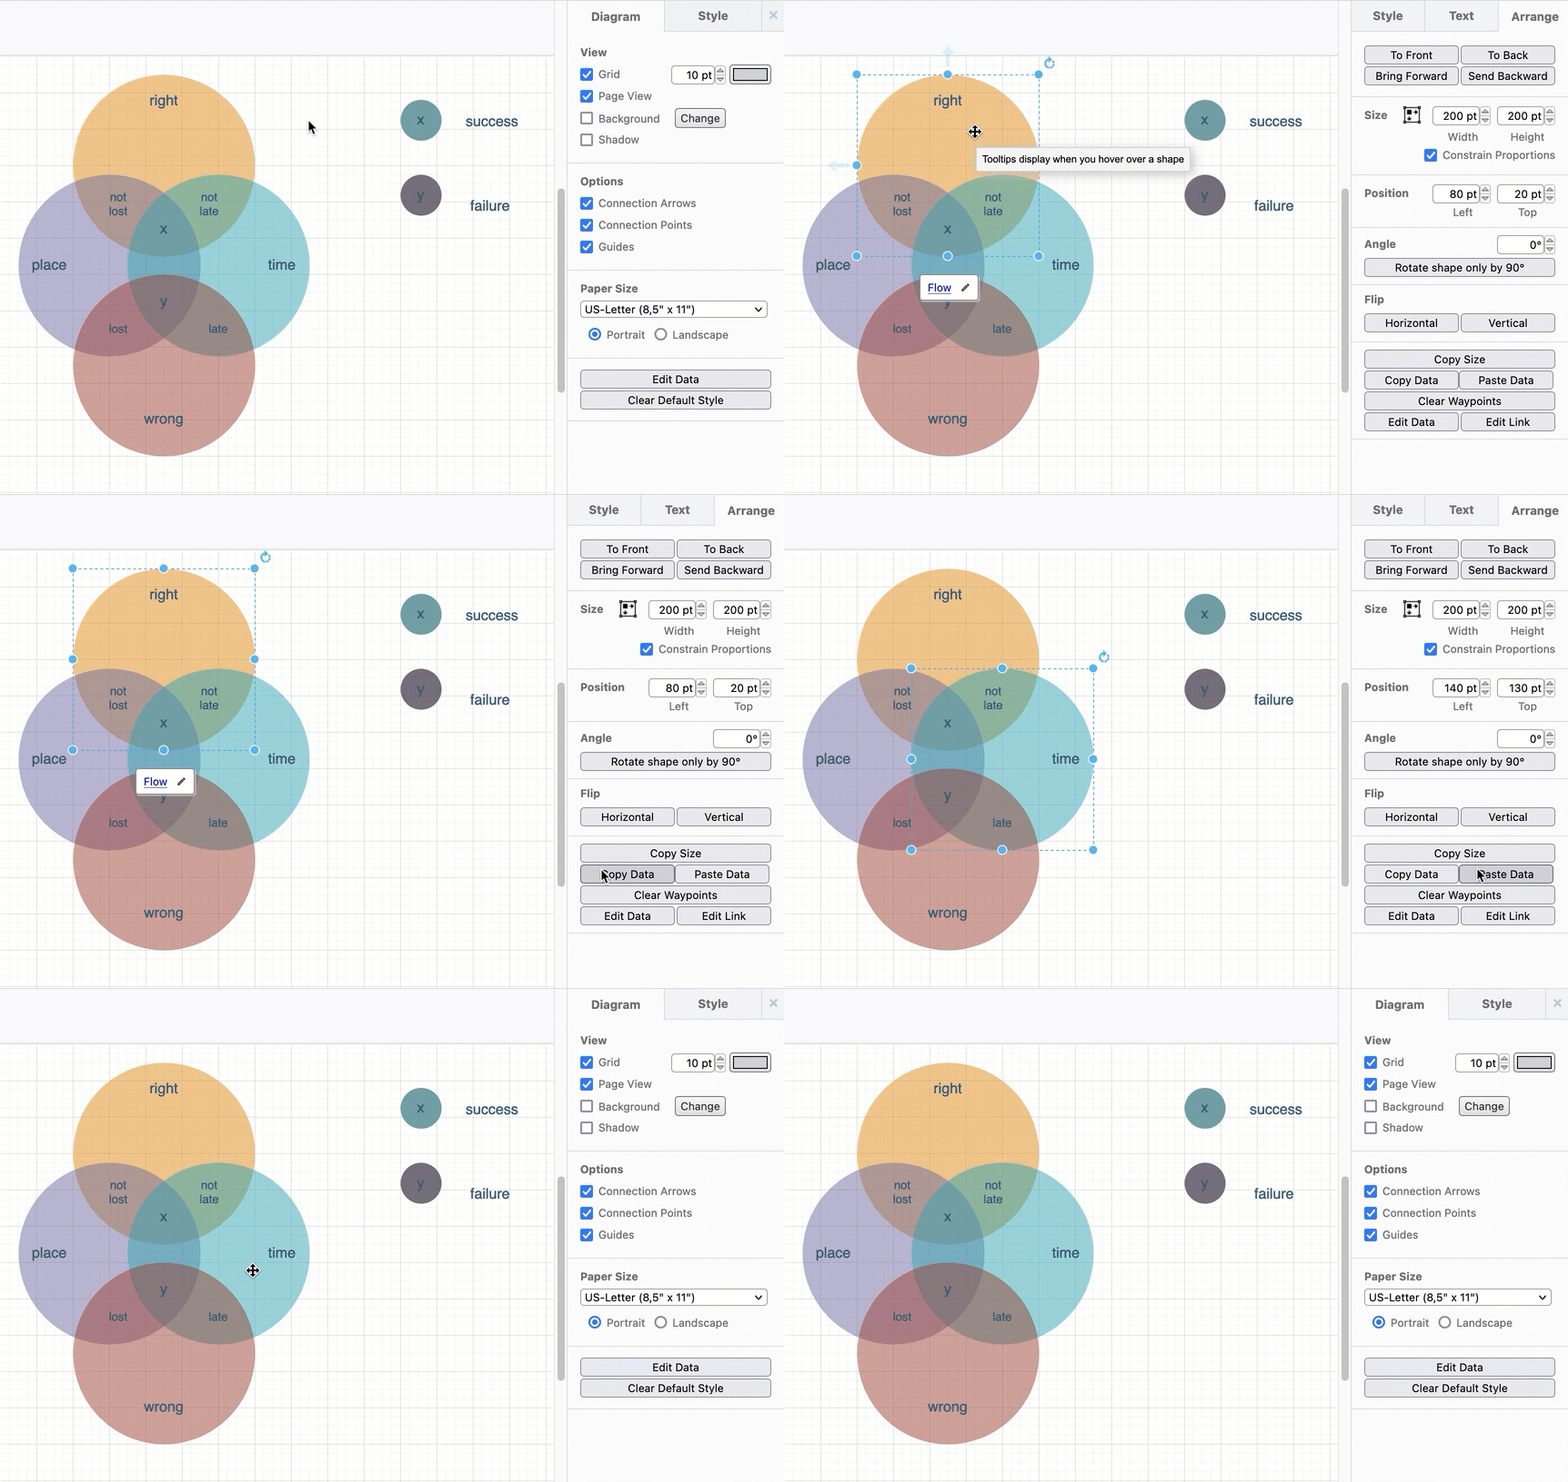
Copy shape data from one shape to another
- Select the source shape that contains the shape data you want to copy.
- Click Edit > Copy Data in the Style tab of the format panel on the right.
- Select the target shape, and click Edit > Paste Data in the Style tab to overwrite the source shape’s metadata.
Extract shape data
- Select the shape with the metadata that you want to export.
- Click on Edit > Copy Data in the Style tab of the format panel on the right.
- Click Export to see the shape data as it appears in XML, including the shape’s label text, styles and shape properties (if defined).
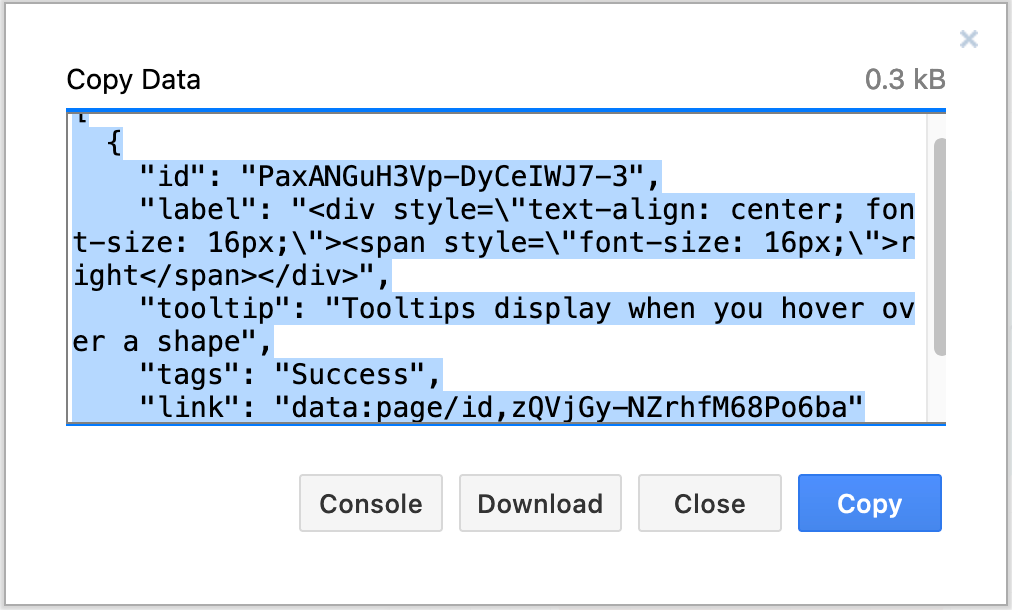
Dev Tools: Click Console to export the shape data to your browser’s console.
Use pre-defined shape properties
In draw.io, some shape properties are predefined, including tags, tooltip and link.
You can add these separately via their own dialogs - you don’t have to edit the shape data directly through this shape properties dialog.
Add tooltips to shapes
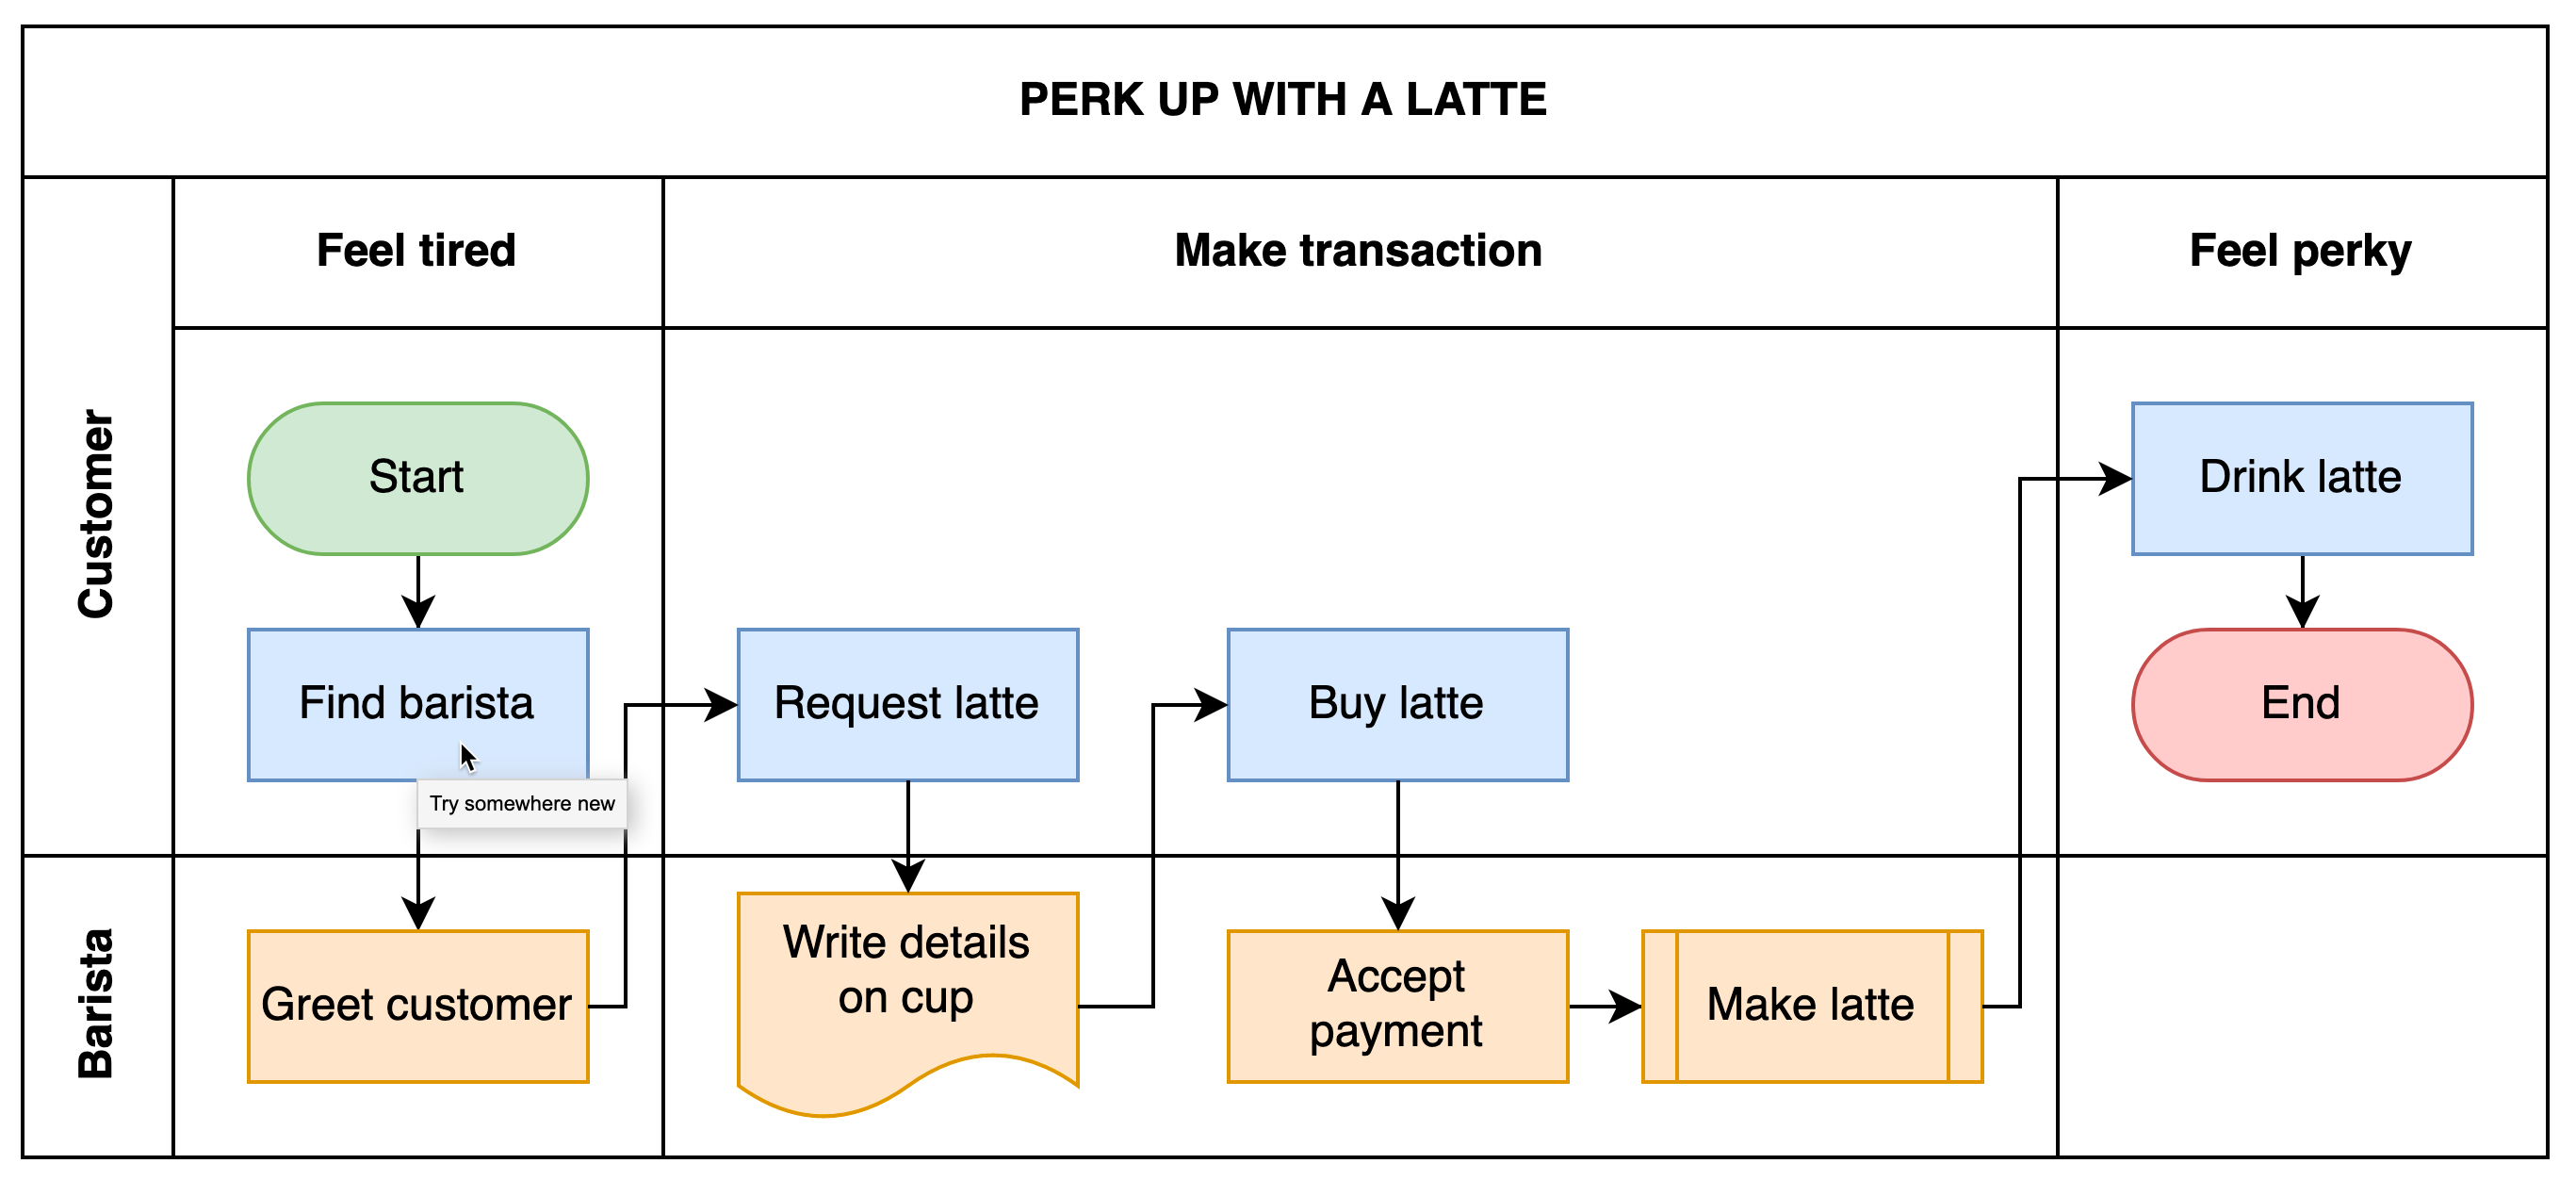
Tooltips are another type of shape metadata, which appear when you hover over a shape in the editor or in the lightbox viewer. Tooltips are useful in training diagrams, or for attaching notes to shapes when collaborating on a diagram with team members.
Select a shape, then select Edit > Edit Tooltip from the menu, or press Alt+Shift+T to add or edit a shape’s tooltips.
Learn more about using tooltips
Add links to shapes
You can point your diagram’s audience to more information stored on another page in your diagram or on the web by adding a link to a shape.
The target URL appears as a tooltip when you hover over a shape. If the shape also has a tooltip, that will be displayed instead.
Use custom links on shapes to add in-diagram interactivity. Custom links are written as a comma-separated list of JavaScript objects (JSON), and added just as you would a normal link.
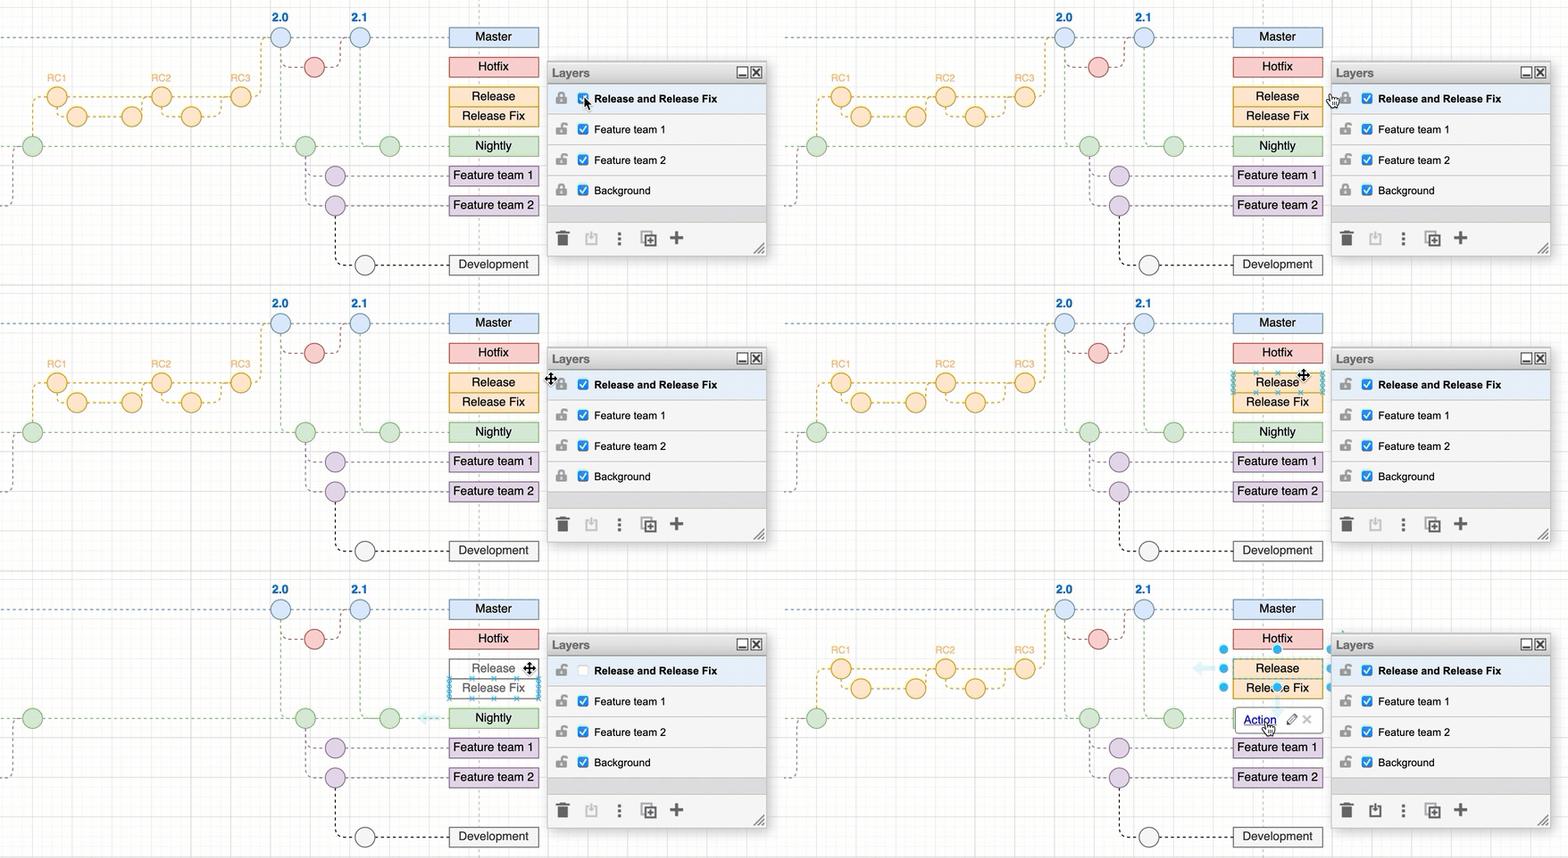
See how to build a custom link in draw.io
Alternatively, you can add interactivity with tags on related shapes.
Use tags to display and hide related shapes
Tags are a predefined type of shape metadata, and provide you with a way to relate shapes, connectors and text without grouping them together or placing them all on the same layer in your diagram.
Display and hide such related shapes based on their tags in both the draw.io editor and lightbox viewer. Tags make it easier for you to work with complex diagrams, or add interactivity to training diagrams.
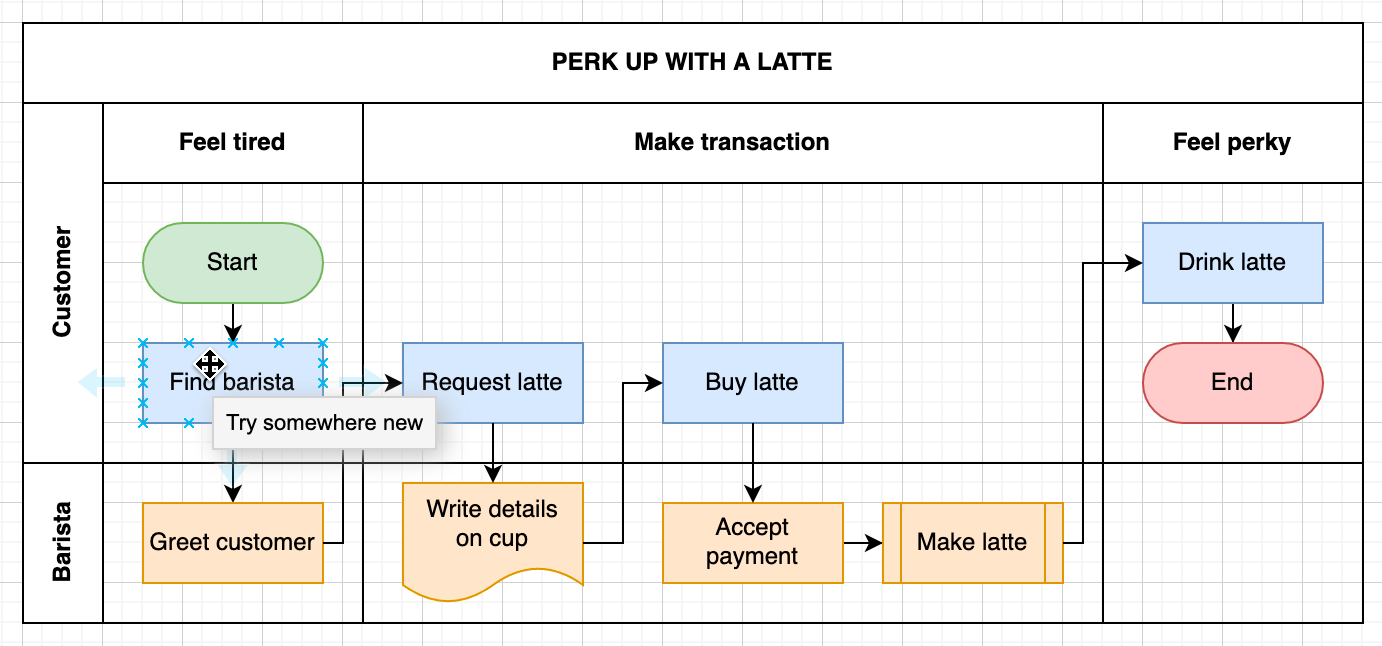
Learn more about using tags in diagrams
Use custom shape properties
By applying custom properties or metadata to shapes, you can add any additional information to the elements in your diagram that your audience may need to understand clearly.

Make sure you have not defined a tooltip if you want to show the custom shape properties when you hover over a shape.
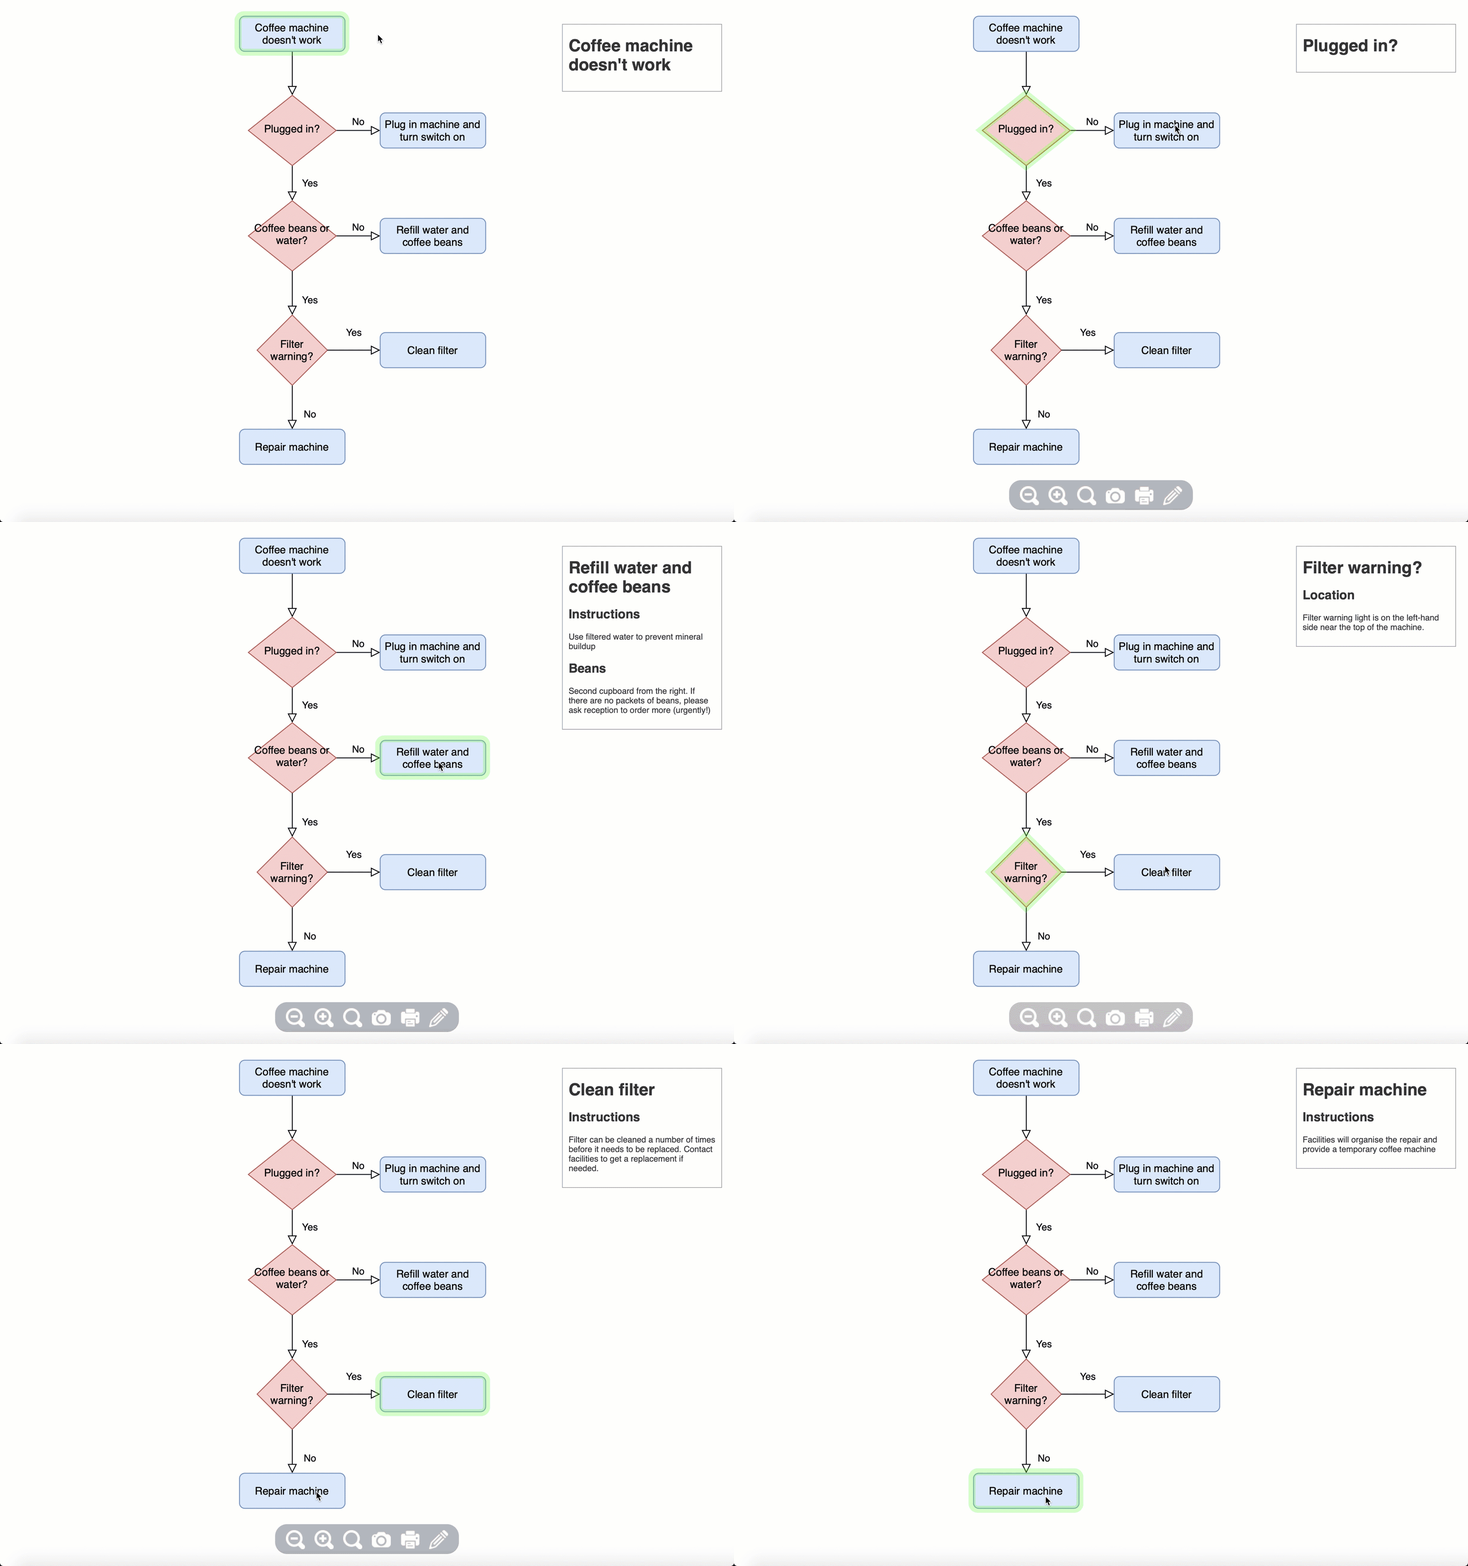
Dev Tools: The properties plugin - exposes shape data in the draw.io editor and lightbox viewer when you hover over shapes, as shown below.
Use custom properties with placeholders
You can do some useful and interesting things with custom properties, including automatically changing their values when using placeholders (which work like variables).
For example, you can change a shape’s fill colour, or label based on its location - inside a specific container shape or another. Placeholders can be used in label and tooltip text, as well as in shape metadata.

Learn more about using placeholders
Custom properties can also be applied globally, not just to shapes, connectors and text. Make sure nothing is selected in your diagram, then click Edit Data.
Edit shape style and geometry
While shape style and geometry information are not treated as shape properties, you can edit them in a similar way to editing shape properties. In this way, you can create more complex custom shapes for your diagram.
To see shape style information, select a shape press Ctrl+E on Windows or Cmd+E on macOS, or select the shape and click Edit > Edit Style in the Style tab of the format panel. Edit the XML directly to describe a different shape style.
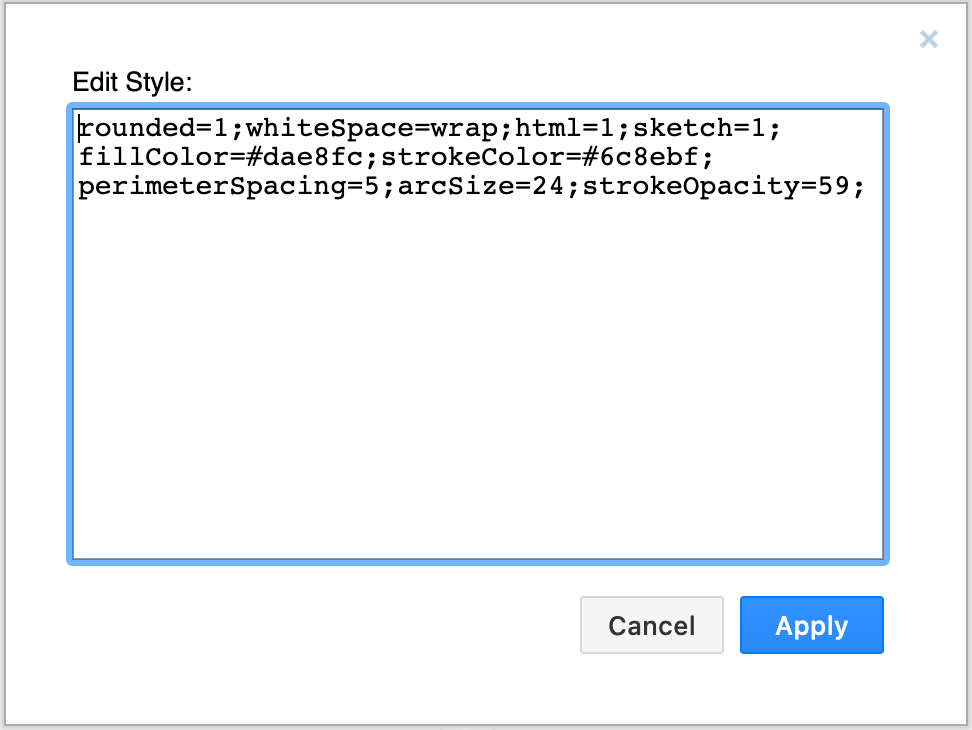
To create custom shapes, you need to describe the shape geometry in addition to the shape style. In the draw.io editor menu, click Arrange > Insert > Shape. Enter the geometry and style information in the text field.
